
Inland port planning: what teams can compare with GenAnywhere
River behavior, land connections, and the parcels that sit between them
An inland port works when the river, the rail line, and the highway agree about the same piece of land. Planning teams compare those systems long before a terminal layout exists, and the comparison is easier when every candidate is shown the same way. GenAnywhere builds an editable 3D site model from a map selection, which gives a planning group a shared picture of the ground while the options are still open.
1 What an inland port plan depends on
1.1 How does river level shape the site?
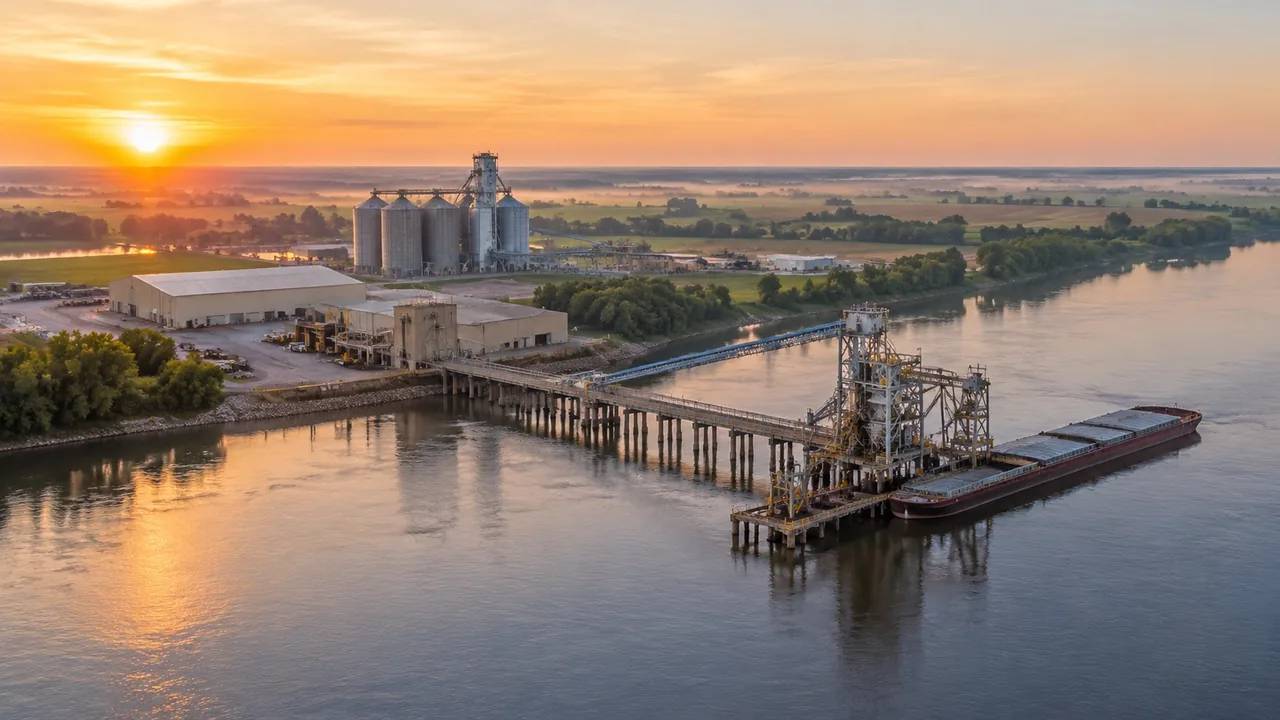
Inland port planning starts with the river, because the water sets the floor of every later decision. River level is not a single number. Seasonal high water, ordinary stage, and the low-water weeks all change how a bank can be used. A terminal pad set too low may be unreachable during a flood; one set too high may need a long ramp and a bigger cut into the bluff. Looking at the bank in 3D shows the vertical gap between the water and the usable ground, which is the basic fact a barge operation needs. It also shows where a levee or a road embankment already limits access to the water.
1.2 Which land connections decide the layout?
A barge terminal is as useful as the rail and road links behind it. A site beside a main line but without a feasible spur may cost more than a site a few kilometers farther out with a short connection. Highway access has the same logic: a direct ramp is worth more than a wide gate onto a county road. Drawing the rail corridor, the highway, and the parcel together lets a team see which connections are short, which cross something expensive, and which create a conflict with the surrounding town.
2 How to compare candidate parcels
2.1 What should stay the same across candidates?
Use one camera set, one layer setup, and one list of questions for every parcel. If the Pad A view is taken from a drone height and the Pad B view from across the river, the reader learns more about the photographer than the land. Keep the same assumptions about berth length, yard depth, and warehouse footprint, even when the site cannot hold them, because the gap between the assumption and the land is part of the finding. Record the settings so the comparison can be repeated by someone who was not in the room.
2.2 How do teams read rail and road access?
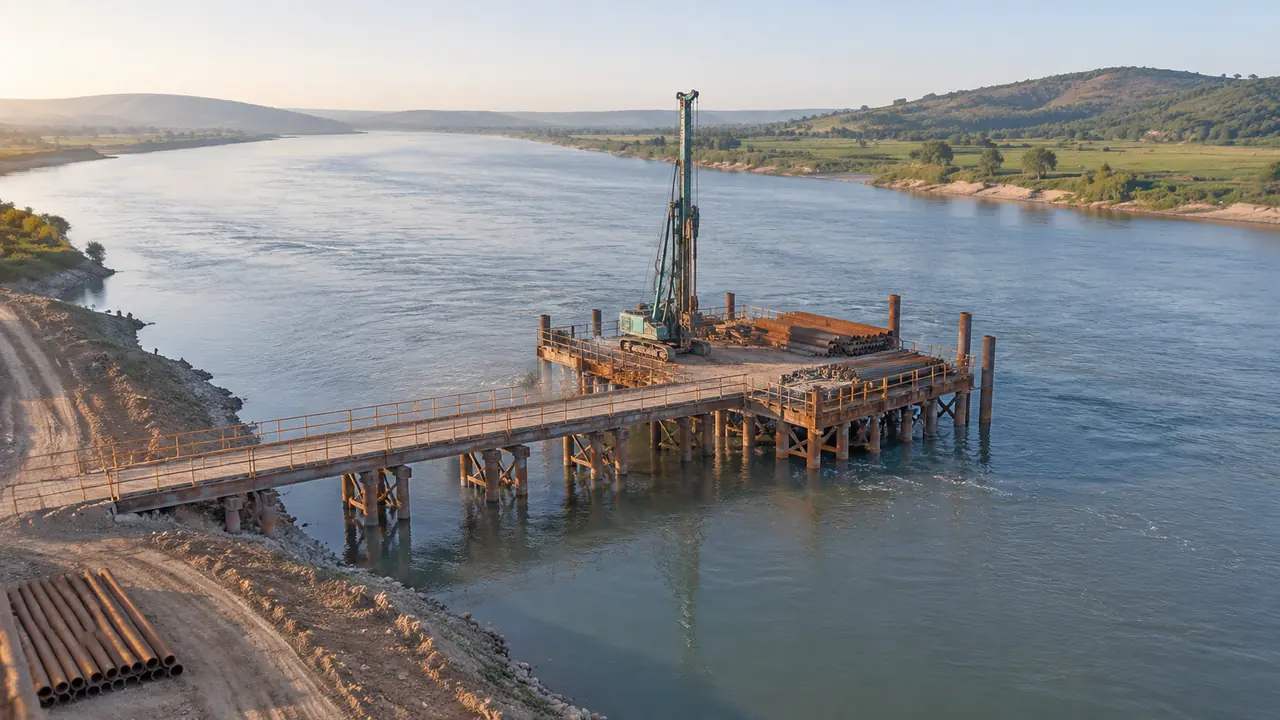
Start where the connection meets the network, then work toward the water. A spur that leaves the main line on a curve may need more land than a straight turnout, and a road that climbs a bank may need a cut that changes the drainage. The Maritime Administration publishes planning material for port and waterway projects that helps teams frame these questions. On the model, mark the connection path and the constraints it crosses, then compare how much of each path sits on land the project can control.
3 Where a 3D view helps a planning conversation
3.1 How does the model support board and public review?
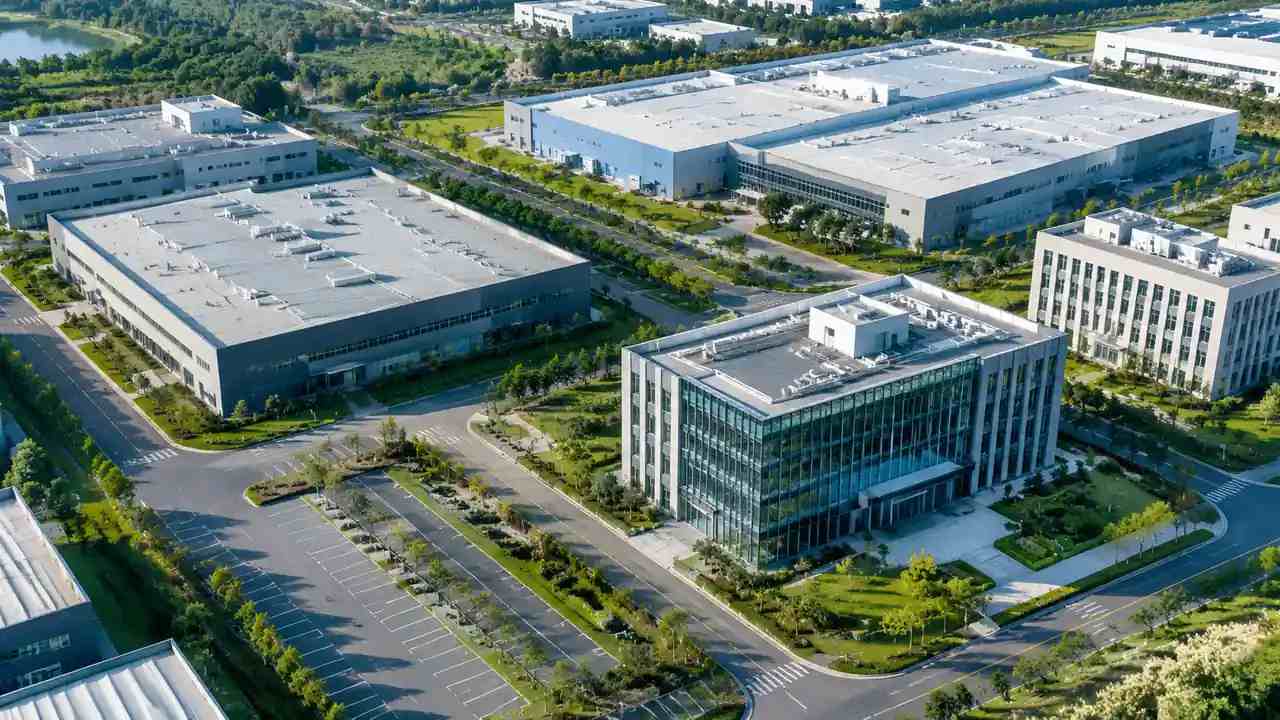
A plan sheet shows the project boundary, and a photograph shows the view from one spot. A 3D scene lets a resident or a board member see the same site from the bridge, from the levee, and from the edge of town. That helps a discussion about scale, screening, and traffic without asking people to read a grading plan. The scene can also show where a warehouse roof would sit against a tree line, which is often the detail that decides whether a project feels large or modest from the road.
3.2 What should the model not be used for?
The scene is not a hydraulic study, a title search, or a permit exhibit. It cannot tell a team whether a channel will stay navigable, whether a bank will hold, or whether a parcel can be assembled. Those answers come from hydrology, geotechnical work, and land records. Use the model to ask better questions of those studies, and keep the studies in charge of the answers. When a meeting starts to treat a rendering as evidence, the review has drifted, and someone should say so.
4 Working with the surrounding land
4.1 How do floodplain and wetland questions enter?
Floodplain and wetland limits come from regulatory maps and field review. A model built from satellite sources may show low ground and wet-looking areas, but it cannot draw a legal boundary. What it can do is show how a proposed pad, road, or rail spur relates to the ground that looks wet, so the team knows where to commission a study. Record the source date of the imagery and the name of the regulatory map being used. Keep the two separate in the notes, because a picture and a boundary are not the same kind of evidence.
4.2 How do nearby communities shape the layout?
Truck routes, rail crossings, and noise all land on someone's street. Putting the site in context shows which approach sends traffic past a school and which keeps it on an industrial road. It also shows where a berm, a row of trees, or a building placement could reduce the visual impact without changing the operation. Those choices are easier to discuss when the neighborhood is part of the same scene, rather than a separate map that nobody opens during the terminal layout discussion.
5 Where GenAnywhere fits the port workflow
5.1 What can teams build and adjust?
GenAnywhere generates a 3D scene from an area chosen on a map, then lets a team edit what it finds. Buildings can be replaced, moved, rotated, or changed in height and type; terrain, water, and vegetation are generated and fitted to the ground; and buildings, terrain, and planting can be viewed and managed as separate layers. For an inland port, that makes it practical to test a longer berth, a deeper yard, or a different warehouse row without rebuilding the whole study. The model is a working surface, not a fixed illustration.
5.2 What does the export support?
After preview, the scene exports as a general GLB file that can move into 3D, BIM, GIS, and game engine workflows, including the directions covered in the official tutorials. That gives a planning team a way to share the site with an architect, a rail engineer, or a public meeting without asking each of them to install the same authoring tool. The file is a review scene, not a survey product, and the receiving software decides how coordinates are handled. Test the handoff early, especially when several consultants are involved.
6 Limits and next steps
6.1 When is a model the wrong starting point?
If the central question is dredging volume, bank stability, or the legal status of a parcel, a surface model will not answer it. The same is true when the project depends on a rail agreement or a funding decision that has nothing to do with geometry. In those cases, the model can wait. Start with the study or the negotiation, then use the scene to show what the agreement means on the ground. A tool is useful when it answers the question in front of the room.
6.2 What belongs in a comparison memo?
Keep it short: one page per parcel, the same views, and a table-free list of what each site offers and what it would need. Name the connection distances, the ground that looks wet, the access conflicts, and the studies still required. Add a line on source dates and who built each scene. A memo like this does not pick a winner. It shows the board why one parcel needs more work than another, which is usually the decision in front of them.
6.3 How does a team begin?
Choose two parcels that are genuinely in contention, and build both before the next working session. Keep the geometry simple and the questions specific. The aim is to test whether the comparison method holds up, not to produce a finished exhibit. If the two scenes make the trade-offs clearer, expand to the rest of the list. If they do not, change the questions before adding more sites.
Start with a map selection in the browser app, then follow the site workflow to prepare the comparison.
7 FAQ
FAQ-1 Does the platform measure channel depth?
No. Channel depth comes from hydrographic surveys and navigation charts, not from a surface scene built on map and satellite data. The model can show the bank, the water edge, and the land behind the terminal, which helps a team place a berth and ask where depth data is needed. Treat the scene as context for the survey, not as a replacement. Any dredging or navigation decision should rest on the responsible authority's data and the project's own marine studies.
FAQ-2 Can a model show barge turning areas?
It can show the water surface and the bank shape around a proposed terminal, which helps a team see where a turning basin would sit relative to the shore. It cannot confirm that a basin is navigable or that a barge can maneuver there. Those questions belong to a marine study and to the operators who know the river. Use the scene to locate the conversation, then bring the navigation analysis into the same discussion before the layout hardens.
FAQ-3 How do teams handle several parcels?
Build each parcel as a separate area and keep one view set for all of them. Name the files so the parcel and the date are obvious, and keep a short note on the assumptions used in each scene. When the list is long, compare in rounds rather than all at once. An early round can remove sites with an obvious constraint, and a second round can look closely at the survivors. The method matters more than the number of scenes.
FAQ-4 What does the export include?
The export is a general GLB scene containing the buildings, terrain, water, and vegetation shown in the preview. It does not carry survey coordinates, legal boundaries, or utility records. Teams use it for visualization, design discussion, and public communication, and they confirm how the receiving software handles scale and orientation. If a downstream tool needs a native format, check that tool's documentation before promising a file that the pipeline cannot use.
Content and technical notes
This article was prepared by the GenAnywhere team with AI-assisted drafting and human review.
Product features, formats, and availability change as the platform evolves; refer to the official GenAnywhere website for current details.
For technical questions or corrections, contact support@genanywhere.com.
Last reviewed: 2026-11-08.