
Flood recovery planning in Georgia: rebuild options, GenAnywhere
How a small town can compare rebuild scenarios before the funding clock starts
Flood recovery moves faster than most planning processes, and the decisions that matter are often made with incomplete information. A site model will not answer the hard policy questions, but it can show a town what a few rebuild options would look like on the ground. That shared picture is useful when residents, engineers, and program staff need to talk about the same place.
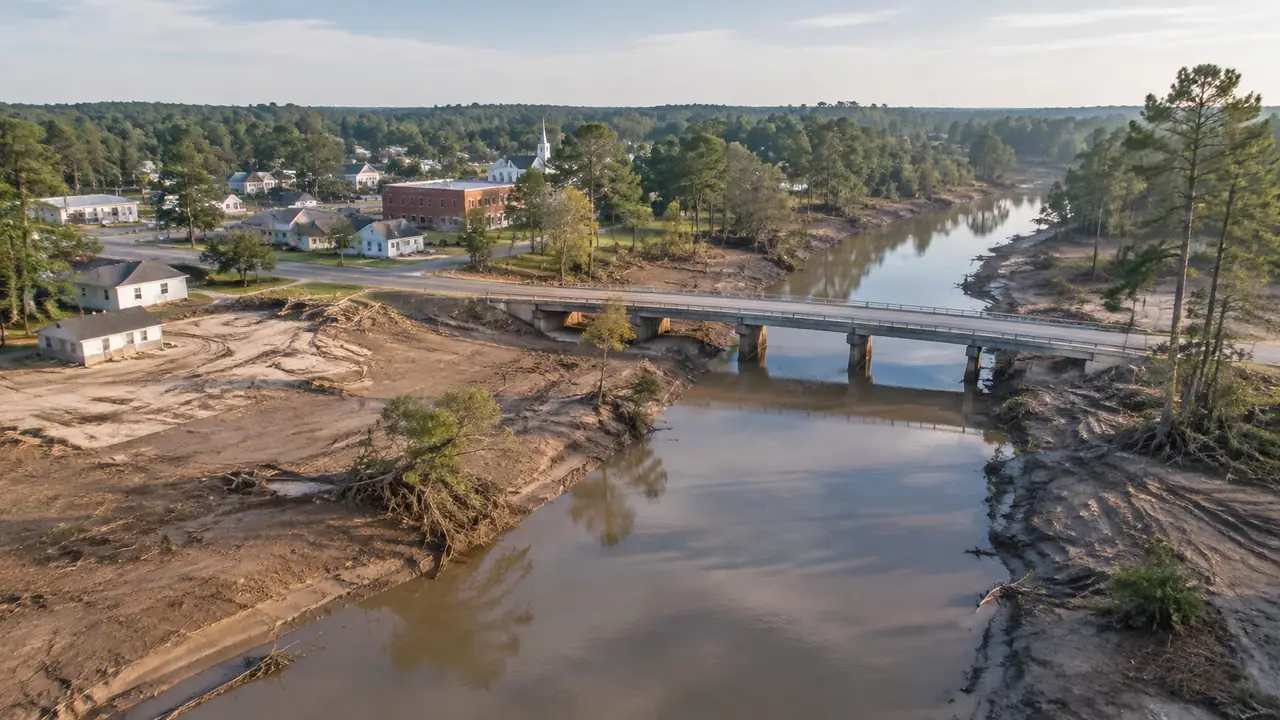
1 What recovery planning needs early
The weeks after a flood are a blur of inspections, insurance calls, and temporary housing. Planning for the rebuild often starts before the damage assessment is complete. A town that waits for perfect data may lose the chance to shape the recovery.
1.1 The questions that come after the water
Residents want to know whether they can rebuild in place, whether the road will be raised, and whether the lot next door will stay empty. Local staff want to know which infrastructure is worth repairing and which sites should be retired. These are spatial questions before they are financial ones.
1.2 Why a shared picture helps
A plan drawing shows one option to one audience. A model lets a group look at the same scene from the same angle and point at the same corner. That sounds simple, but it changes the tone of a meeting when people are tired and worried.
2 Reading a Georgia river town
Georgia's flood-prone communities range from mountain valleys to coastal lowlands, and the terrain changes what recovery can look like. A town on a narrow river terrace has less room to move than one with open land behind it.
2.1 Floodplain edges and buildable ground
A terrain model shows where the ground rises and where it stays low. That helps a town see which blocks sit on the edge of the floodplain and which are consistently wet. The model does not define the regulatory floodplain, but it makes the shape of the land easier to discuss.
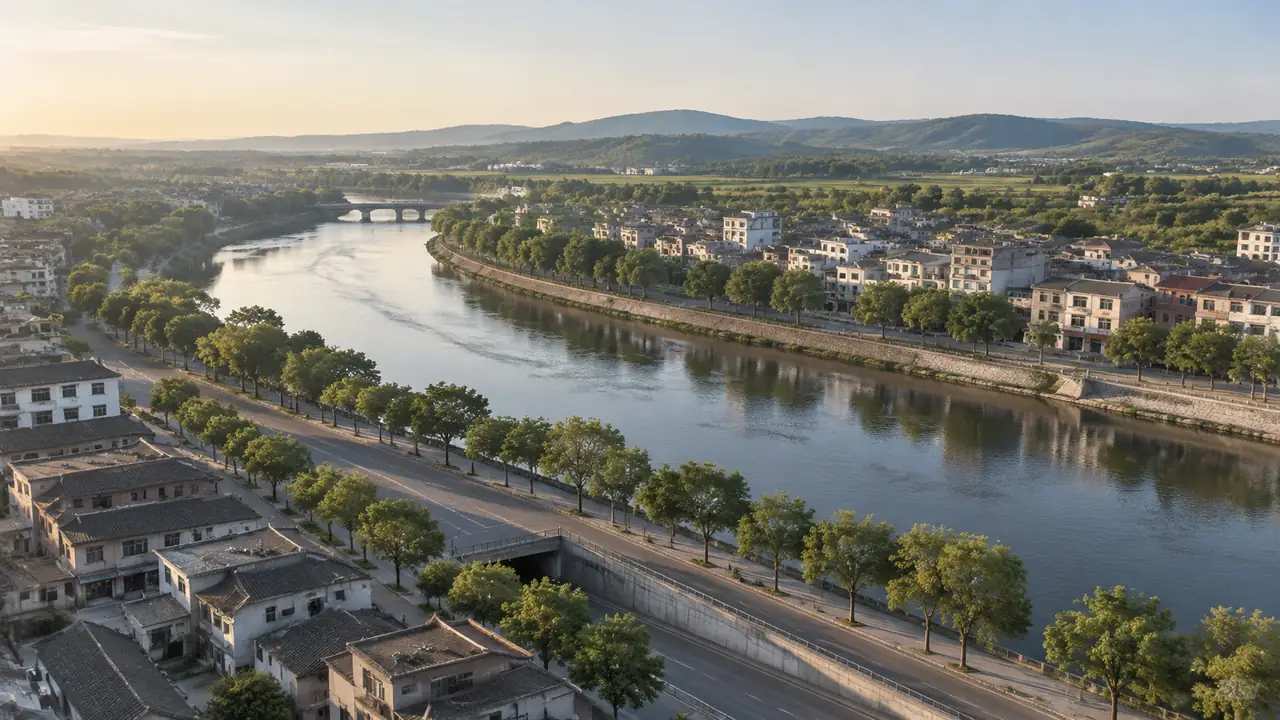
Look at the town from the water as well. A view from the river shows which buildings sit closest to the bank and where a new setback would change the street. That perspective is hard to get from a plan sheet.
2.2 Roads, bridges, and access
Recovery often depends on a single bridge or a road that floods before anything else. A model can show how a closed crossing isolates a neighborhood and where a temporary route might go. It can also show which utilities or public buildings sit on the same vulnerable corridor.
3 Sketching rebuild options
A rebuild sketch is not a design. It is a way to test a few moves before the town commits to a study. The goal is to find the option that raises the fewest hard questions.
3.1 Building the existing scene
GenAnywhere builds an editable 3D site model from an area selected on a map, using satellite and map data. It identifies building footprints, estimates heights, infers building types, and reads surrounding vegetation. Terrain, water, buildings, and vegetation come in as separate layers, so a town can start with the existing condition and turn layers on or off as needed.
The model can be previewed in the browser and exported as GLB for 3D, BIM, GIS, or game engine workflows. A planning team can use that file to prepare views for a public meeting or a session with state staff. The model is a planning aid, not a survey product, and it does not carry survey coordinates.
3.2 Testing a few moves
Start with three moves: rebuild in place, rebuild on higher ground, and leave a block open as a park or detention area. Each move can be sketched with simple building masses and an adjusted road layout. The point is to compare how each one changes access, open space, and the number of properties affected.
A town can also test a raised road or a new bridge approach. These moves are harder to show with a plan drawing, because the change is mostly vertical. A 3D view makes the difference visible to people who do not read contours.
4 Keeping the conversation grounded
A model can create false confidence if it is presented as a plan. The people using it need to say what it is for and what it leaves out.
4.1 What the model cannot decide
It cannot determine eligibility for any program, set a property value, or certify a building as safe. It cannot model the performance of a levee or predict the next flood. Those questions belong to engineers, appraisers, and program staff who work with current rules.
The model also cannot represent the social side of recovery. A block that looks empty on an image may still hold a tight community, and a lot that looks buildable may be owned by someone who does not want to sell. Those facts come from conversation.
4.2 Working with state and federal programs
Program staff need to see the site, the affected area, and the proposed change in a consistent format. A model can help prepare that package, but the program's own maps and rules govern the decision. FEMA publishes hazard mitigation and recovery guidance that explains the vocabulary and the sequence of review.
A town should ask program staff which format they prefer before building a large file. A simple PDF with clear views may be more useful than an interactive model nobody can open. Matching the deliverable to the reviewer saves time on both sides.
A short call with a program officer can save a week of formatting work. Ask what they need to see, and build the model views around that answer.
5 From options to a project list
5.1 A simple scoring sheet
List each option and score it on access, cost range, number of properties affected, and ease of permitting. The scores will be rough, but the exercise forces the group to name what it values. A model view can sit beside each row so the discussion stays concrete.
Keep the sheet short. A long matrix invites false confidence, and a short one keeps the meeting focused on the two or three choices that matter. Update it after each conversation with engineers or program staff.
5.2 What to bring to a funding conversation
Bring the site views, the option sketches, the scoring sheet, and a clear statement of what is still unknown. Funders tend to respond better to a team that can describe its gaps than to one that presents a polished but fragile plan. The model supports that honesty by showing the site as it is.
It also helps to bring a short list of projects that can start while larger decisions wait. A drainage repair or a temporary access route may be easier to fund than a full relocation. The model can show where those smaller projects fit.
Keep a simple index of files and dates. Recovery teams often revisit decisions months later, and a clear record makes that review possible without starting over. A named contact on each document also helps when a new staff member picks up the file.
6 A realistic path to resilience
6.1 When a model helps
A model helps when the town needs to compare locations, explain a trade-off, or brief people who cannot visit the site. It is also useful for keeping a record of what was considered, which matters when staff change during a long recovery.
GenAnywhere fits the early part of that work because a scene can be assembled from a map selection and shared in a browser. The layers make it easy to isolate the buildings, the terrain, or the water. That flexibility keeps a meeting from drowning in detail.
6.2 When to bring in engineers
Bring in engineers when the question turns to structural safety, hydraulic performance, or the cost of a specific repair. A model can help write the scope, but it cannot substitute for the analysis. The same applies to legal and financial questions, which need their own advisers.
6.3 A next step
Choose one block that flooded and build a model of the surrounding neighborhood. Open GenAnywhere, select the area, and use the workflow to prepare views for the next recovery meeting.
7 FAQ
FAQ-1 Can GenAnywhere show flood risk?
No. It shows terrain, water, buildings, and vegetation from map and satellite data, but it does not calculate flood risk or replace a regulatory flood map. A town should use the current flood insurance study and local records for that question. The model can help people see where the water sits in relation to the streets.
FAQ-2 Does the model include damaged buildings?
It includes building footprints and estimated heights from the available imagery, which may predate the flood. A damaged or demolished building may still appear. The town should update the scene or annotate it with field information before showing it to residents or posting it on a public site for comment.
FAQ-3 Can we use it for a grant application?
It can support an application by providing clear site views and a record of the options considered. It does not establish eligibility or replace the required engineering and environmental documentation. Check the program's current requirements and ask staff which exhibits they find useful and which format they prefer to receive.
FAQ-4 How should a town start?
Start with one neighborhood and one question, such as whether a road can stay open during high water. Build a small scene, review it with a few residents and staff, and write down what the model gets wrong. That early pass will show whether a larger study is worth the effort.
Content and technical notes
This article was prepared by the GenAnywhere team with AI-assisted drafting and human review.
Product features, formats, and availability change as the platform evolves; refer to the official GenAnywhere website for current details.
For technical questions or corrections, contact support@genanywhere.com.
Last reviewed: 2026-11-07.