
Seismic digital twins: where do teams use GenAnywhere?
How a site context model supports resilience planning without pretending to be a simulation
A seismic digital twin is usually described as a model of a district, and that description hides a division of labor. The simulation team owns ground motion and structural response. The site team owns the blocks, the streets, and the relationships between them. GenAnywhere works on that second layer, building an editable district scene from map data and exporting it into the tools where the analysis happens.

1 What a seismic twin needs from the site layer
1.1 Why context comes before calculation
A response model needs to know what is around the building. The height of the neighbor, the width of the street, the distance to the nearest open space, and the route a response vehicle would take all shape the conclusions. Those facts are spatial, and they are often scattered across drawings and GIS layers. A model that ignores them can answer the wrong question very well.
A shared scene pulls them into one place. It does not improve the calculation. It makes the calculation answer a question that matches the district, which is a different and often more useful outcome. It also gives the simulation team a boundary to work inside.
1.2 The block, the street, and the lifeline
Resilience work tends to focus on three things: the building, the block it sits on, and the route that connects it to help. A scene can hold all three at a consistent scale. That consistency matters when a planner is comparing a hospital block with a residential one. Scale consistency is what makes that comparison fair.
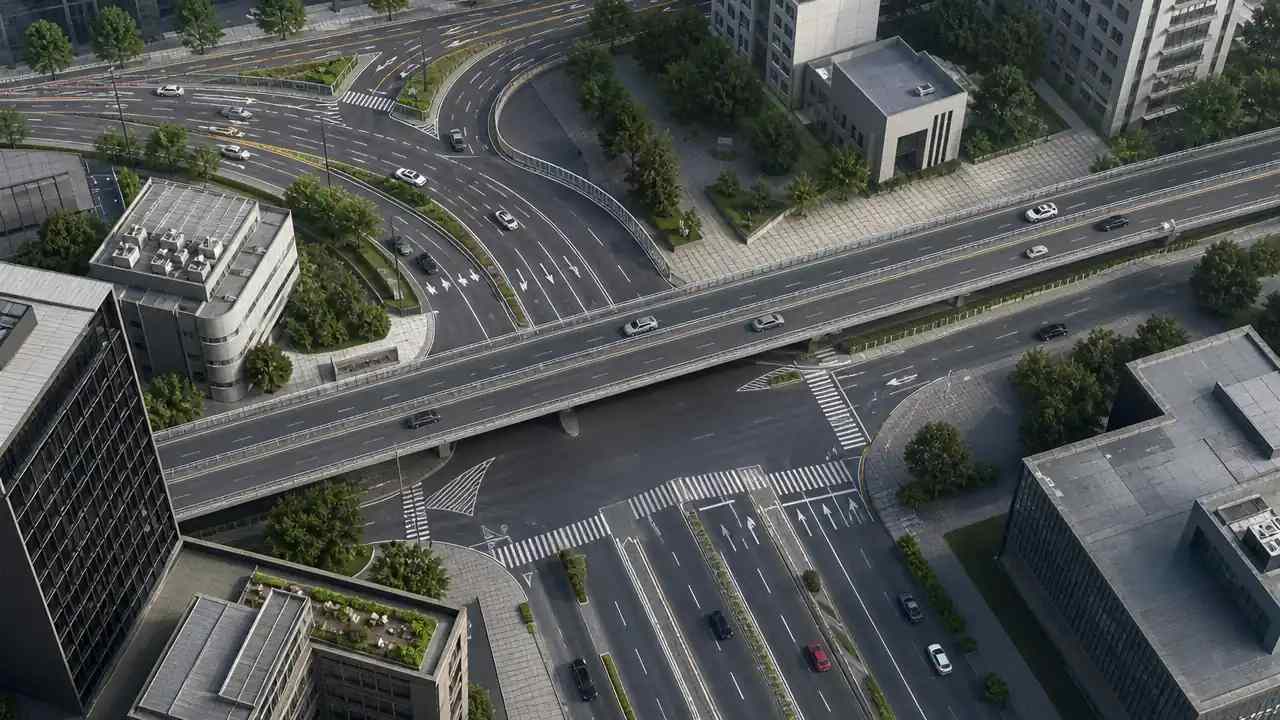
The route is the part teams underestimate. A street that looks wide on a map can be narrowed by parked cars, trees, and a bus stop. Seeing it in three dimensions changes how a response route is described. It also changes where a crew would stage equipment.
2 Building a district scene from a map
2.1 Choosing an area that includes the response routes
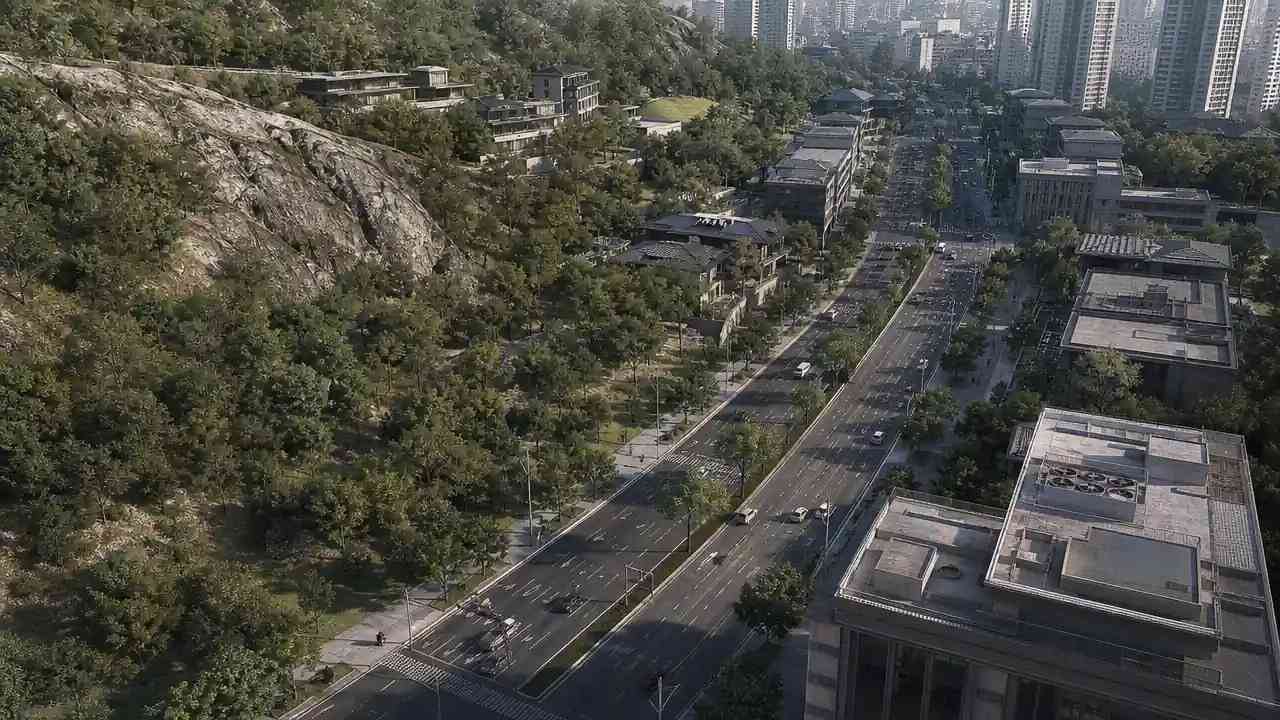
Select an area that covers the buildings under study and the streets that serve them. If the boundary cuts a response route in half, the exercise loses the connection it is trying to test. A route that leaves the scene is a route the group will forget. In GenAnywhere, the selection generates an editable model with buildings, terrain, water, and vegetation in place.
Include the open spaces. A park, a school yard, or a wide intersection may be the assembly point in a plan, and its size relative to the surrounding blocks is easier to judge in a scene. The same applies to a rail yard or a stadium lot that could serve as a staging area.
2.2 Massing the buildings and the open spaces
Keep the buildings simple. A block with the right height and footprint is enough for a district conversation. GenAnywhere lets you replace a building, move or rotate it, and change its height and type, which supports the what-if questions that come up in a workshop. The model stays light enough to edit while people talk.
Try one change at a time. Adding a floor to a corner building, removing a low structure to open a yard, or shifting a proposed tower are the kinds of moves that a resilience group argues about. Each takes a few minutes in the scene. Keep a note of which change each view represents.
3 Using the scene in resilience work
3.1 Briefing retrofit options block by block
A retrofit program usually has more candidates than budget. A scene lets a committee walk the district and see which blocks share a typology, which ones sit beside a critical route, and which ones have open space next to them. Those patterns are hard to see in a table of buildings.
The scene does not rank the candidates. It gives the committee a common picture for the ranking, which is often the difference between a decision and a stalemate. It also gives the committee a way to explain the ranking outside the room.
3.2 Rehearsing access after an event
Tabletop exercises often use a map with markers. A 3D view adds the dimension that matters for access: what is between the vehicle and the destination. A collapsed frontage, a narrow street, or a rail crossing can turn a short route into a long one. A scene makes that detour visible before anyone drives it.
Walking the route in the scene is a rough exercise, and it is still useful. It surfaces the bottlenecks that a plan view hides, and it gives the group something concrete to argue about. Arguments about a specific corner tend to end faster than arguments about a principle.
4 Where the scene stops
4.1 Ground motion, structure, and lifelines
The scene contains no ground motion, no structural model, and no utility network. It cannot tell you how a building will perform, where a pipe will break, or how long a recovery will take. Those answers come from engineering and from the utilities. Each of those teams works with data the scene does not hold.
What the scene can do is show the geometry those studies depend on. That is a supporting role, and it is worth being clear about it in every meeting. A short caption on the screen does most of that work.
4.2 Avoiding false comfort
A polished district model can look like an answer. The risk is real: a viewer sees a tidy scene and assumes the analysis behind it. Label the scene as context, state the source of the heights, and keep the simulation results in a separate view. Color and labels should make the difference obvious at a glance.
That separation protects the work. The scene stays a planning tool, and the analysis keeps the authority it earned. That division also makes the next study easier to commission.
5 Sharing with engineers and officials
5.1 Exporting to simulation and design tools
GenAnywhere exports a general GLB that opens in Unreal Engine, Unity, Blender, Revit, Rhino, SketchUp, ArcGIS Pro, and similar tools. An engineering team can use it as the district context for a simulation, and a design team can use it to test a retrofit scheme.
The file is a starting point. Detailed geometry, materials, and networks come from the receiving team, and the export should be described that way. A short note on what is included prevents a misunderstanding later.
5.2 Running a tabletop exercise
Project the scene, fix a few viewpoints, and give the group a scenario. The value comes from the questions, not from the visuals. Where does the response vehicle stop? Which block has no open space? Who is cut off if the bridge closes?
Write the answers on the scene as notes and keep them with the file. A tabletop that produces a list of questions is more useful than one that produces a consensus nobody can defend. Keep the list with the scene so the next exercise starts from it.
6 Where this fits
6.1 Teams that benefit
City resilience offices, engineering firms preparing a district study, and campus emergency planners get value from a shared scene. So do community groups that need to understand a plan in their own neighborhood. Insurance and utility teams sometimes join these sessions, and they ask different questions.
6.2 When a GIS map is enough
If the question is a simple overlay of hazard and assets, a GIS map answers it. A scene earns its place when height, sight lines, or street-level access change the answer. Those conditions are common in dense districts. When the district is flat and sparse, the map usually carries the argument.
6.3 A short checklist
Confirm the study area, the response routes, and the open spaces. Decide which retrofit or access questions the group will test. Set the viewpoints and state the estimated heights. Then build the district and keep the massing simple. A district scene should open quickly on a meeting room laptop.
You can build a district scene at the GenAnywhere app and see how it moves into analysis tools on the workflow pages. For hazard context, USGS earthquake hazards publishes data that a site scene does not replace.
7 FAQ
FAQ-1 Does the model simulate an earthquake?
No. It holds buildings, terrain, and streets, and it does not calculate ground motion or structural response. Use it to build the district context for a simulation, then let the engineering team run the analysis in a tool built for that purpose. The scene gives that tool a district to sit inside.
FAQ-2 Can it show liquefaction or fault lines?
It can display a reference layer if you bring one in, but it does not model subsurface conditions. Liquefaction and fault mapping come from geological studies. The scene helps a group see where those findings fall relative to buildings and routes. That overlay is often the most useful thing the scene does in a hazard meeting.
FAQ-3 Is it usable for a resilience plan?
It is useful as the spatial layer of a plan. A resilience plan also needs hazard analysis, engineering assessments, and policy decisions. The scene supports the parts that depend on layout, access, and the relationship between buildings. It also helps a city explain the plan to residents without opening a simulation.
FAQ-4 How current is the building data?
It reflects the map and imagery available for the area at the time the scene is built. New construction may be missing, and heights are estimated. For a study that depends on a specific building, confirm the footprint and height against a current source. That check is quick and it prevents a wrong assumption from traveling into a study.
Content and technical notes
This article was prepared by the GenAnywhere team with AI-assisted drafting and human review.
Product features, formats, and availability change as the platform evolves; refer to the official GenAnywhere website for current details.
For technical questions or corrections, contact support@genanywhere.com.
Last reviewed: 2026-11-13.