
Transit funding: how do agencies weigh site options in GenAnywhere?
A consistent 3D view of each station area gives boards and residents something concrete to compare.
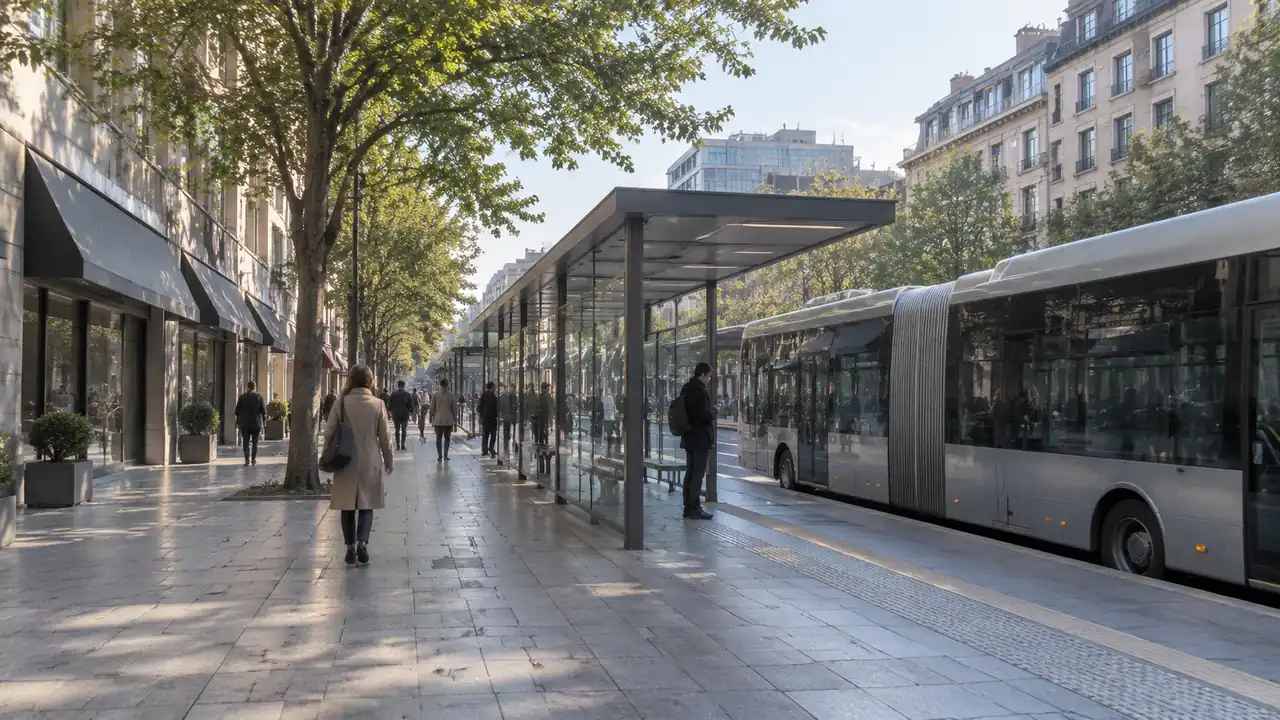
Transit funding decisions compare projects that are hard to compare. A rail extension, a bus rapid transit corridor, and a station rebuild touch different ground, serve different riders, and ask different questions of a neighborhood. A shared 3D view of each site gives a board and a public audience something concrete to weigh. It also keeps the discussion on ground that the project team can actually show.
1 What funding review asks of a site
Funders want to know what a project would do, where it would sit, and who would feel the change. The site view answers the middle question, and it helps the other two stay grounded.
1.1 Fair comparison beats a strong image
A polished rendering can win a room and lose a review. Agencies that compare options on equal terms, with the same views and the same notes, produce a record that holds up when a board member asks why one option looks better. Equal treatment also protects smaller projects, which often cannot afford the imagery that larger ones can. Agencies that name the comparison rule before they see the options are less likely to bend it later.
1.2 Community questions are part of the case
Funding reviews now expect public input, and public input tends to focus on specific places: a crossing, a parking lot, a row of shops. A 3D scene lets a resident point at the corner they mean. That specificity improves the comment record and gives the project team a clearer sense of which concerns repeat across meetings. A map that residents can point at also reduces the chance that a comment is recorded as a vague objection.
2 Build a comparable view of each option
The practical work is to define one frame and apply it to every option. That frame should include the station or stop, the access routes, and the surrounding blocks that riders walk through.
2.1 Set the same frame per station area
With GenAnywhere, a team maps each station area and generates an editable 3D scene from satellite and map data. Buildings, terrain, water, and vegetation arrive as layers, so the same camera position can be reused for every option. A planner can adjust a building volume to test a different entrance or a small plaza, then preview the change before export. Consistent frames make the comparison about the sites rather than about the screenshots. A reviewer who sees the same frame twice can focus on the difference that matters.
2.2 Show access, not just the building
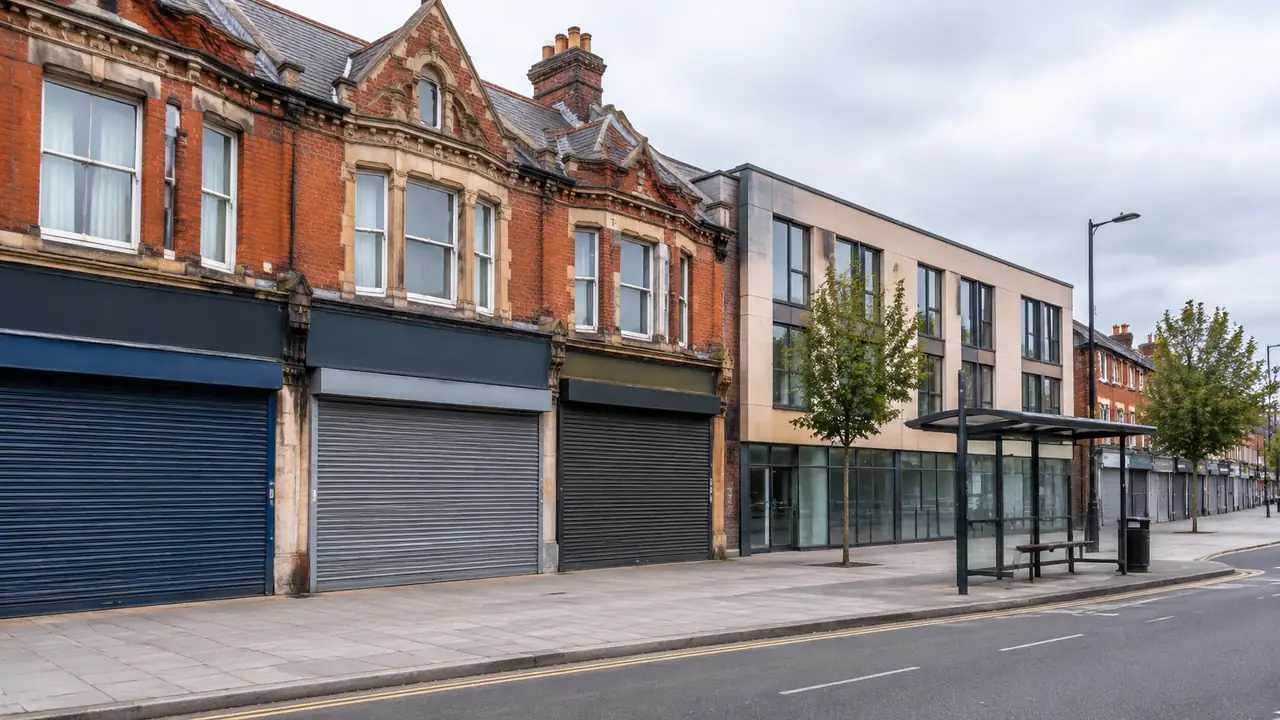
Riders reach a station on foot, by bus, by bike, and by car. The access routes often matter more to the surrounding neighborhood than the station itself. Show the sidewalks, the crossings, the bus loop, and the parking edge in the same view as the station. A comparison that shows just the building hides the parts of the project that generate public comment. Show the route a rider would actually take, including the awkward crossing that a site plan tends to omit.
3 Separate the site case from the funding case
A site scene can support a funding case without becoming one. The financial model, the ridership forecast, and the eligibility test sit with analysts and with the program that holds the money.
3.1 What the scene can support
The scene can show where an option sits, what it displaces, and how it relates to the surrounding blocks. It can illustrate a walking route, a bus interchange, or a phased construction edge. Those are spatial facts that a board can see. They help a project team explain a choice, and they give the public a shared reference during comment. The scene can also show what an option removes, such as a parking row or a mature tree, which is often the detail residents raise.

3.2 What belongs in the financial model
Cost, ridership, operating subsidy, and cost-effectiveness come from separate models with their own assumptions. A 3D scene cannot validate any of them. Keep the two workstreams linked by a common option name and a shared map, not by implying that a good-looking site is a good investment. That separation protects the analysis from being swayed by presentation. A short note that links each option to its financial model keeps the two workstreams connected without merging them.
4 Use the scene in public meetings
A meeting room is where a site scene does its most visible work. The goal is understanding, not persuasion.
4.1 Layers for different audiences
Different audiences ask different questions. A resident wants to see the station entrance and the parking edge; a planner wants the parcel boundary and the surrounding zoning; a board member wants the comparison across options. GenAnywhere keeps buildings, terrain, and vegetation in separate layers that can be turned on or off, so one scene can serve all three conversations. The same model can be adjusted during the meeting when a comment reveals a detail worth showing. Keep a saved view for each recurring question so the next meeting does not start from scratch.
4.2 Record the questions raised
A public meeting produces comments that are easy to lose. Capture the place each comment refers to and the view that was on screen when it was raised. A short list of place-based questions is more useful to the project team than a transcript. It also shows the public that their specific corner or crossing was heard, which improves the next meeting. Sort the comments by place at the end of the evening; the pattern is usually clearer than any single remark.
5 Keep the evidence trail short
An option review should be auditable without being heavy. A few habits will do.
5.1 Date and label every view
Put the imagery date, the option name, and the camera position on each view. A small label prevents a later reader from comparing two images taken from different heights and drawing a false conclusion. It also makes the review reproducible, because a colleague can return to the same vantage point when a question comes back months later. A naming rule helps as well, such as option letter plus view number plus date.
5.2 Note what was not evaluated
List the questions the scene did not answer: ridership, cost, environmental review, right-of-way, and service frequency. A limits list beside the options keeps the review honest and helps a board separate spatial evidence from financial evidence. When a member asks about ridership, the list points to the right document instead of inviting an answer from the image. The same list gives the public a clear sense of what the current phase can and cannot settle.
6 Bringing the option review together
The sequence below keeps a funding conversation organized around decisions rather than images.
6.1 State the decision the board faces
Write the decision in one line, such as whether to advance two station options or one corridor option. The phrasing shapes the comparison, because a station decision and a corridor decision need different views and different ground. Write the decision at the top of the packet so every view can be read against it. The site workflow overview shows where the review sits in that packet.
6.2 Compare like with like
Use the same frame, the same imagery date, and the same labels for every option. If one option needs a different area to make sense, say so and show the difference. A comparison that quietly changes the frame is not a comparison, and a board member will notice. If the frame has to change, show both frames and explain why the option needed a wider view.
6.3 Leave eligibility to the funding program
The Federal Transit Administration funding programs set the eligibility rules and the evaluation criteria that govern federal support. A project team can prepare site context and still leave the eligibility question to the program. That boundary keeps the review useful without inviting a promise the team cannot keep.
Open the GenAnywhere workspace to build a consistent view of each station option.
See how the site workflow fits together before the board packet is assembled.
7 FAQ
FAQ-1 Can GenAnywhere calculate cost-effectiveness?
No. The platform does not estimate project cost, operating subsidy, or cost-effectiveness. Those figures come from financial models with their own assumptions and review. A 3D scene shows where an option sits and what it displaces, which helps a team explain the spatial side of a proposal. It should never be presented as evidence for the financial case.
FAQ-2 Does the platform predict ridership?
No. There is no travel demand model behind the scene. Ridership forecasts come from a metropolitan planning organization or a transit agency using established methods and local data. The scene can show station access, surrounding blocks, and walking routes, which may inform a qualitative discussion, but it does not produce a ridership estimate and should not be cited as one.
FAQ-3 What should an option comparison show?
Show the station or stop, the access routes, the surrounding blocks, and any use the option displaces. Keep the camera position, imagery date, and labels the same across options. Add a short limits list for ridership, cost, environmental review, and right-of-way. A comparison built that way lets a board see differences in ground without mistaking presentation for evidence.
FAQ-4 Can the scene support a grant application?
It can illustrate site context in a narrative or a briefing, but it does not carry an application on its own. Grant programs evaluate eligibility, cost-effectiveness, and local commitment under their own rules. A project team can use consistent views to explain a station area and to show how options differ on the ground. The eligibility finding and the financial case remain separate work.
Content and technical notes
This article was prepared by the GenAnywhere team with AI-assisted drafting and human review.
Product features, formats, and availability change as the platform evolves; refer to the official GenAnywhere website for current details.
For technical questions or corrections, contact support@genanywhere.com.
Last reviewed: 2026-11-09.