
Lidar tree canopy and plan updates: Cambridge review with GenAnywhere
How canopy data, a street inventory, and a 3D site model serve an urban forest plan update
Cambridge's tree plan runs on two clocks. One is the planting calendar. The other is the interval between lidar collections, which can leave a canopy dataset two or three years behind the sidewalk. A useful plan update acknowledges both clocks and shows where the data ends.
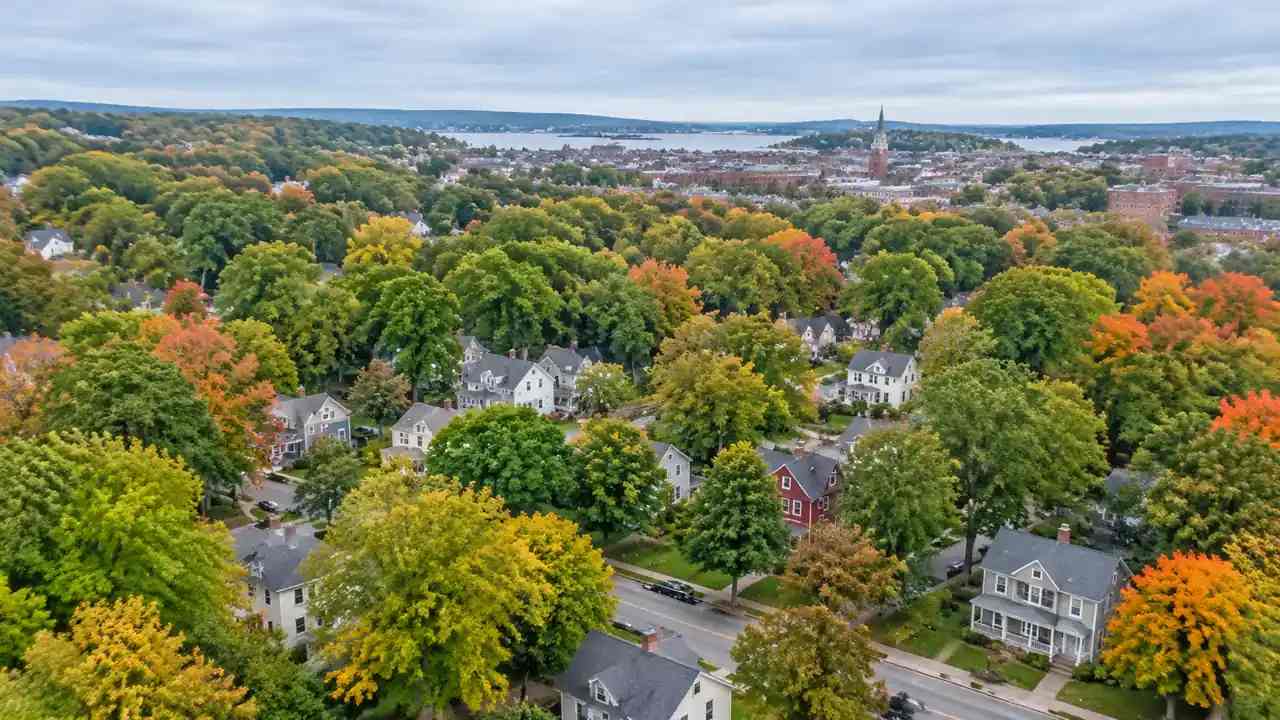
1 What a canopy dataset can and cannot tell Cambridge
A lidar tree canopy layer answers one question well: where the leaves were on the day of the flight. It does not say whether a tree is healthy, whether it is scheduled for removal, or whether the planting pit below it can take another trunk. Plan updates that blur those differences produce targets nobody can deliver.
1.1 Separate cover from condition
Canopy cover is a percentage over an area. Condition is a judgment about species, age, and risk. The two get confused in public meetings because both are described as "the trees." Keep them apart in the memo. Report cover from the dataset, then report condition from the arborist inventory, and show the gap. A block can sit at 38 percent cover and still be losing its mature trees one at a time. When the numbers are separated, the maintenance budget conversation becomes clearer.
1.2 Read last year's plan against today's imagery
Plans age in specific places. A corridor that was slated for infill may already be built out, and a planting strip may have been paved for a driveway. Overlay the plan's action map on current imagery and mark every place where the plan no longer matches the ground. This takes an afternoon and prevents a year of arguing about stale assumptions. It also gives the update a defensible starting point, because every change can be traced to a visible difference rather than to opinion.
2 Where plan updates usually go wrong
Most failed canopy updates share a habit: they treat one dataset as the whole picture. A lidar collection, a tree inventory, and a maintenance log each answer a different question. Using one to settle all three produces a plan that looks rigorous and cannot be implemented.
2.1 Treating one dataset as the whole picture
A regional lidar collection, such as those coordinated by the USGS 3D Elevation Program, is built for terrain and surface modeling, not for street tree management. It sees a crown as a surface, and it cannot tell a street maple from a backyard oak. Street inventories, by contrast, know the species and the pit but cover a smaller area. Pair them deliberately. Use the lidar layer to find where canopy is thin across the city, then use the inventory to explain why a particular street is thin. The explanation is what a plan can act on.
2.2 Forgetting the maintenance backlog
Planting targets are popular because they photograph well. Maintenance is where canopy actually survives. Before adding trees to a block, check the backlog: watering, structural pruning, pest treatment, and removal of hazardous limbs. A block with a full backlog will lose new plantings within a few seasons. The plan update should show maintenance capacity by district, not just planting numbers. That comparison often changes the order of projects more than any canopy map does.
3 Matching canopy goals to specific blocks
Citywide percentages are easy to adopt and hard to use. A goal becomes actionable when it lands on a block with a name, a land use, and a planting constraint.
3.1 Map the gap between target and tree cover
Take the citywide goal and allocate it by district, then compare each district's target with its measured cover. The districts with the largest gap are not automatically the priority. Some are gaps because of soil volume, some because of overhead wires, and some because residents have resisted street trees for parking reasons. Classify the gap before ranking it. A gap caused by soil volume needs a capital project. A gap caused by wire conflicts needs a species list. The plan should name the cause next to the number.
3.2 Weigh shade against planting space
Shade is the benefit most residents notice, and it depends on where trees stand relative to pavement, benches, and bus stops. A canopy map shows the result but not the opportunity. Walk the hot blocks at midday and mark where shade would land if a tree were added at each available pit. This is slow work, and it is the work that makes a plan credible. The output is a short list of blocks where one tree changes the experience of a sidewalk, which is a stronger argument than a percentage.
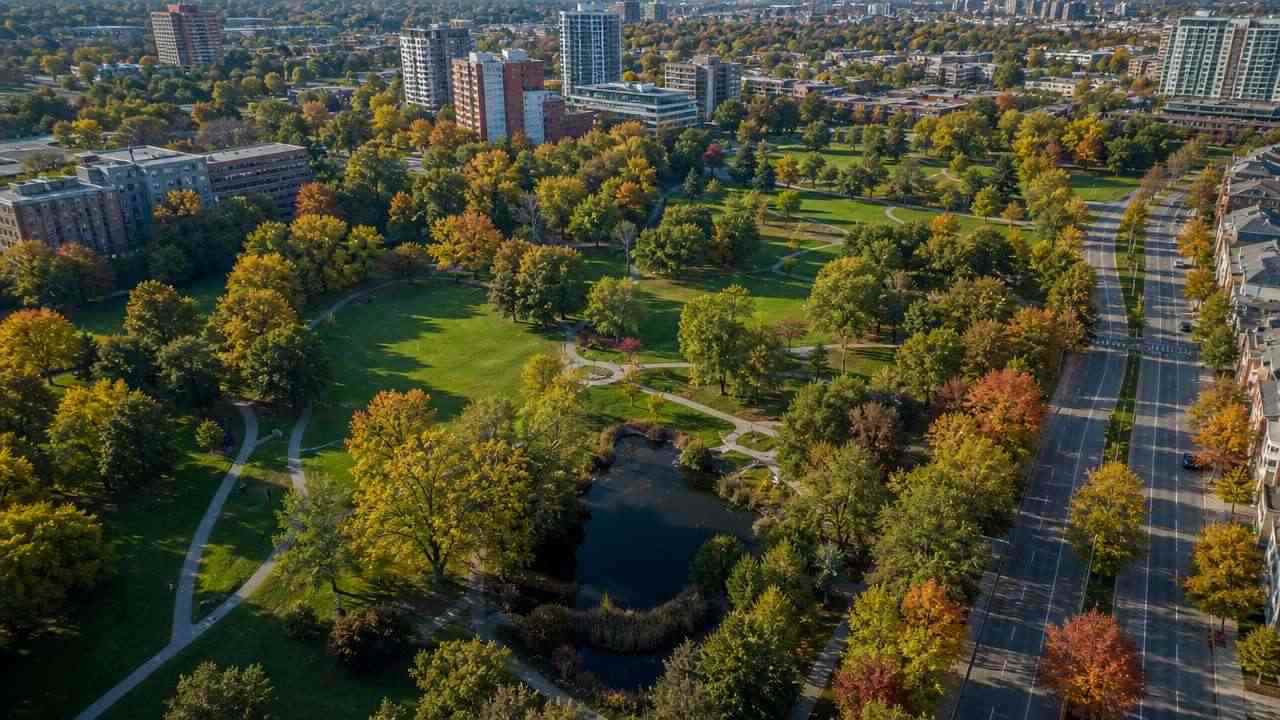
4 A field check that keeps the data honest
Every dataset has a seam where it meets the street. The field check is how you find the seam before a critic does. It does not need to cover the city. It needs to cover the places where the plan makes a claim.
4.1 Sample the block, not the city
Choose ten to fifteen blocks that represent the plan's main moves: a dense residential street, a commercial corridor, a park edge, a new development, and a block with recent removals. Walk each one and count what you see. Compare the count with the dataset and the inventory. Discrepancies are normal. What matters is whether they cluster in a type of block, because a cluster points to a systematic problem in the data rather than a random error.
4.2 Record the conflicts under the canopy
Tree pits fail for boring reasons. A pit may be too small, filled with compacted soil, covered by a grate that was never lifted, or shaded by a sign. Photograph the pit and note the utility conflicts above it. These details rarely appear in a canopy layer, and they decide whether a planting plan can be built. A short field form with five fields is enough: address, pit condition, overhead conflict, soil volume, and observed tree health.
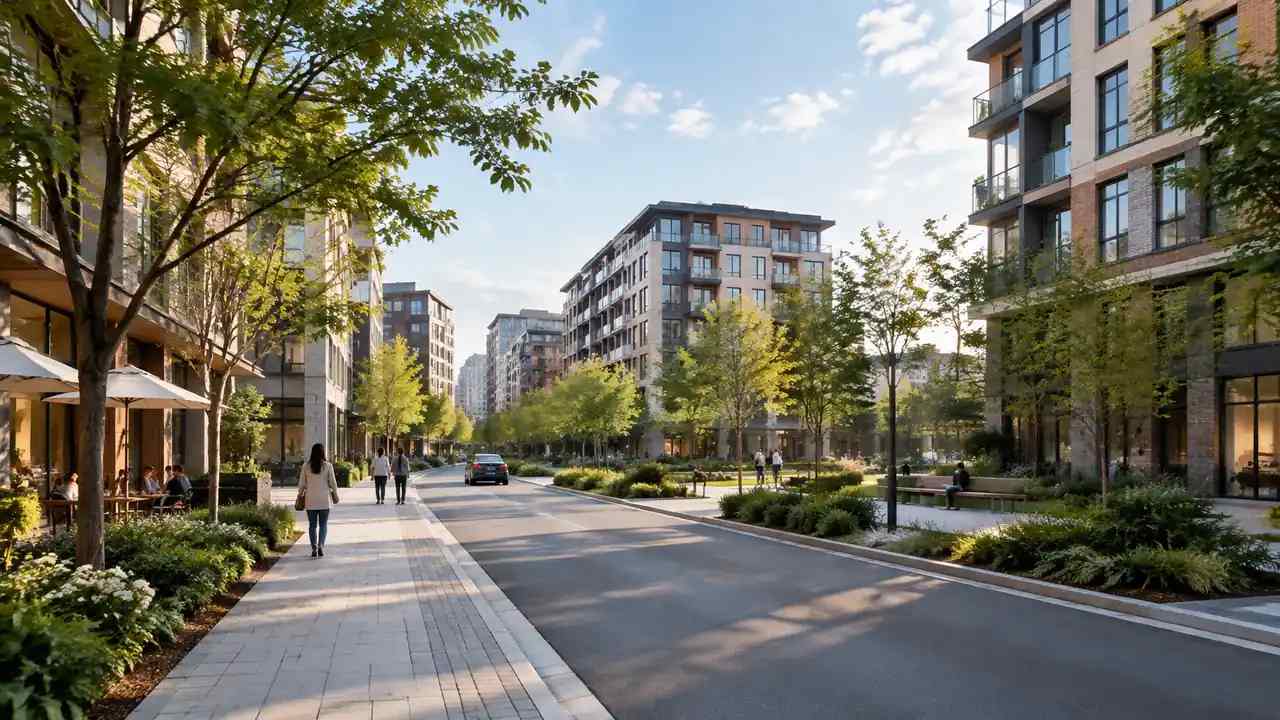
5 Using a site model to argue for a planting plan
A plan update often needs to show a block as it is and as it could be. A 3D site model does that job better than a plan diagram, provided everyone understands what the model represents.
5.1 What GenAnywhere shows and what it leaves out
GenAnywhere builds a site from map and satellite data. It generates buildings, terrain, water, and vegetation as separate layers, and the vegetation layer reflects what the imagery shows at the time of capture. You can orbit the scene, replace a building, and adjust heights to test a massing change. Export is a GLB file for 3D, BIM, GIS, or game engine work. The model does not know species, age, or risk. It shows where canopy sits, not what the canopy needs.
5.2 Where the model should stop
A model can support a planting argument and should not become the argument. It cannot show soil volume, irrigation, or root conflicts, and its vegetation is generalized. Use it to place the block in context and to compare two planting scenarios at eye level. Then put it down and return to the inventory and the field notes. When a plan relies on a rendering alone, the review will ask questions the rendering cannot answer, and the meeting stalls.
6 Turning the review into a plan update memo
The memo is where the analysis becomes a decision. Keep it short enough to read in a meeting and specific enough to survive a budget cycle.
6.1 One map, three numbers
Show one map of priority blocks and three numbers for each: current cover, target cover, and maintenance status. Resist adding a fourth number. The three are enough to rank a block and to explain the rank. A map with three numbers per block is more persuasive than a dashboard with twenty, because the reader can check each claim against a source.
6.2 Sequence planting by maintenance capacity
Order the blocks by the capacity to keep trees alive, not by the size of the gap. A district with a strong maintenance crew and a moderate gap will deliver more canopy than a district with a large gap and no crew. The memo should say this plainly and show the sequence. Sequencing by capacity also builds trust with the crews, who otherwise receive planting lists they cannot service.
6.3 Set a review date
A plan update is a snapshot. Name the date of the next lidar collection and the date of the next inventory refresh, then schedule a review between them. This prevents the plan from becoming an artifact that nobody reopens. A review date also gives the team a reason to keep field notes current, which is how the next update starts with better data than this one did.
To test a Cambridge block in context, open the GenAnywhere app and select the area. The workflow overview shows how map data becomes an editable scene before export.
7 FAQ
FAQ-1 Is lidar canopy data current enough for a plan update?
Often it is close enough to set priorities, but not close enough to certify a block. Lidar collections run on multi-year cycles, and a lot can change in a season of removals and plantings. Check the capture date against the plan's start date. If the gap is more than two years, pair the dataset with a recent inventory and a field sample. State the capture date in the memo so readers can judge the currency themselves.
FAQ-2 Can GenAnywhere measure canopy cover?
No. GenAnywhere generates a site model with a vegetation layer, and it does not compute canopy cover percentages. The layer helps a team see where trees sit in relation to buildings, streets, and open space. Any cover figure should come from the lidar or inventory dataset and be reported separately. Keeping the measurement in the dataset avoids implying that a visual model carries analytical weight it does not have.
FAQ-3 What do Cambridge plan updates need beyond tree counts?
They need species, condition, maintenance capacity, and planting constraints. A count says how many trees exist. Species and condition say which ones will survive a drought or a storm. Maintenance capacity says whether new trees will be watered. Planting constraints say where a pit can actually be built. A plan with counts alone tends to set targets that the operations side cannot meet.
FAQ-4 How should a city handle tree removal during a project?
Document the removal before the permit, then plan replacement on the same block where possible. Record the species, the size, and the reason, because the replacement ratio often depends on those facts. Photograph the pit and the surrounding canopy so the loss is visible in the review. If replacement cannot happen on site, name the receiving location and the maintenance owner. Vague promises to plant elsewhere are where canopy plans lose credibility.
Content and technical notes
This article was prepared by the GenAnywhere team with AI-assisted drafting and human review.
Product features, formats, and availability change as the platform evolves; refer to the official GenAnywhere website for current details.
For technical questions or corrections, contact support@genanywhere.com.
Last reviewed: 2026-11-17.