
Flood system capacity: what should GenAnywhere compare?
What a site model can compare along a flood corridor, and where the hydrology has to take over.
A site model can compare the shape of a flood corridor, the buildings that sit close to it, and the crossings that tie the two sides together. It cannot tell you how much water the system can carry. That number comes from hydrology and hydraulic modeling. GenAnywhere is useful in the space between those two positions: it shows the place clearly enough that the engineering question can be framed.
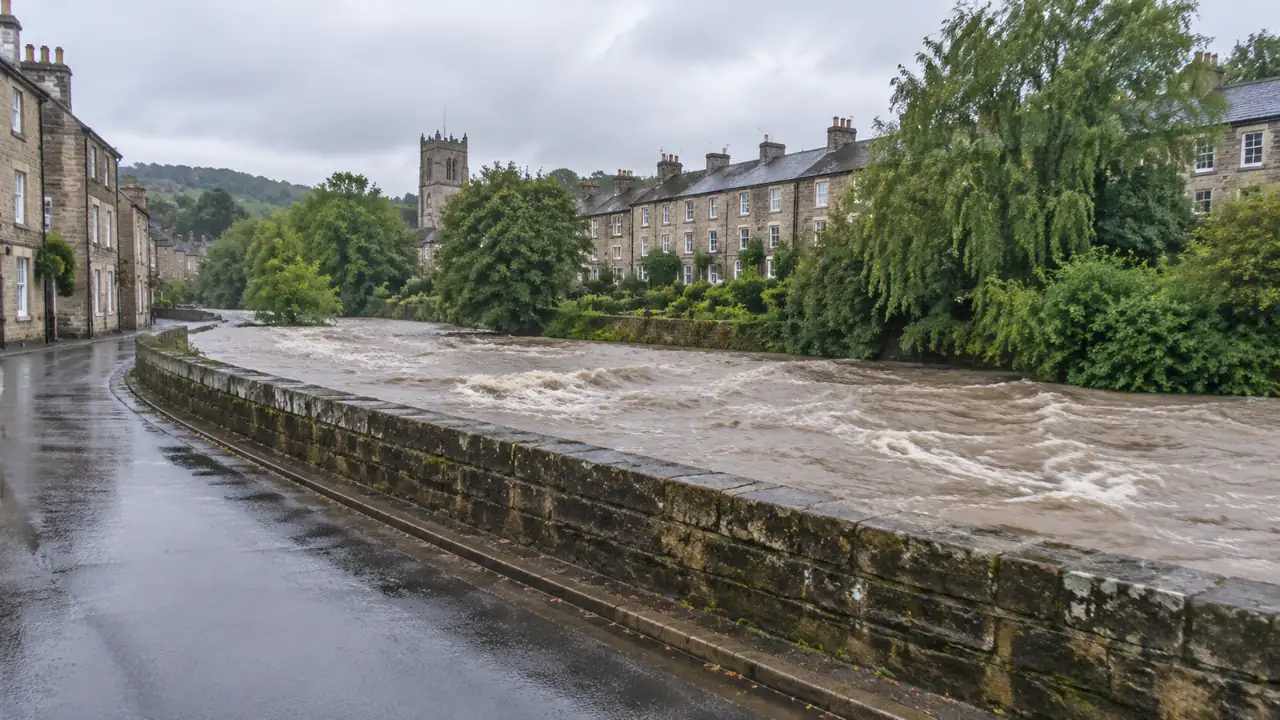
1 Compare the channel, not just the water
A flood corridor is a piece of land with a shape. It widens and narrows, it bends, it passes under bridges, and it runs beside buildings that were built before anyone thought about the corridor as a system. Comparing options starts with seeing that shape, and a plan drawing flattens the information that matters.
1.1 Trace the corridor through the site
Follow the channel from one edge of the site to the other and note where the banks sit relative to the buildings. A corridor that has room to spread reads differently from one that is squeezed between walls. In the model, the bank line and the building line make that difference visible, and the places where the two lines converge become the places worth discussing.
1.2 Note where the section narrows
Narrow sections act as controls on what happens upstream and downstream, which is why they attract attention in every flood review. Mark each narrowing: a bridge, a culvert, a wall, a row of buildings on the bank. You do not need to calculate anything to see that a narrow section is a constraint. You need the engineers to say what the constraint means.
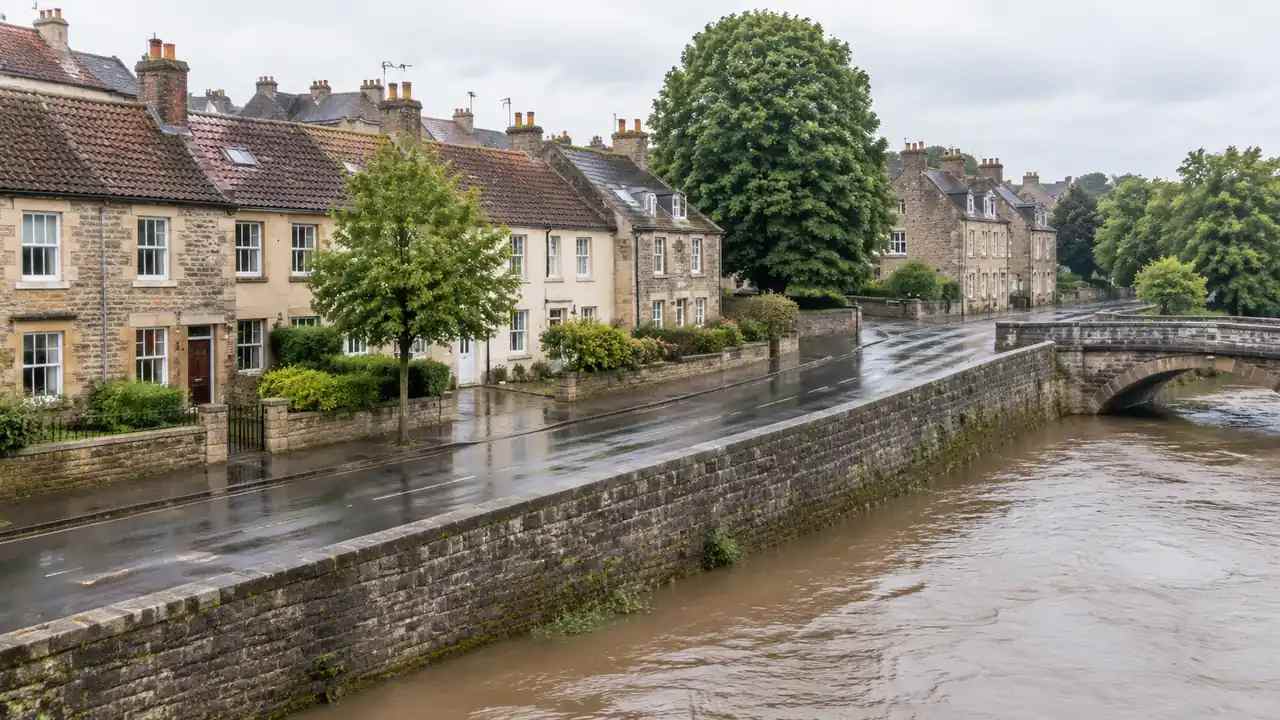
2 Map the low ground around it
Water does not stay in the channel. The low ground beside a river or a drainage line is where it goes when the channel fills, and that ground is often the land everyone assumed was safe because it was not in the mapped flood zone. A terrain layer makes the low ground visible before a dispute starts.
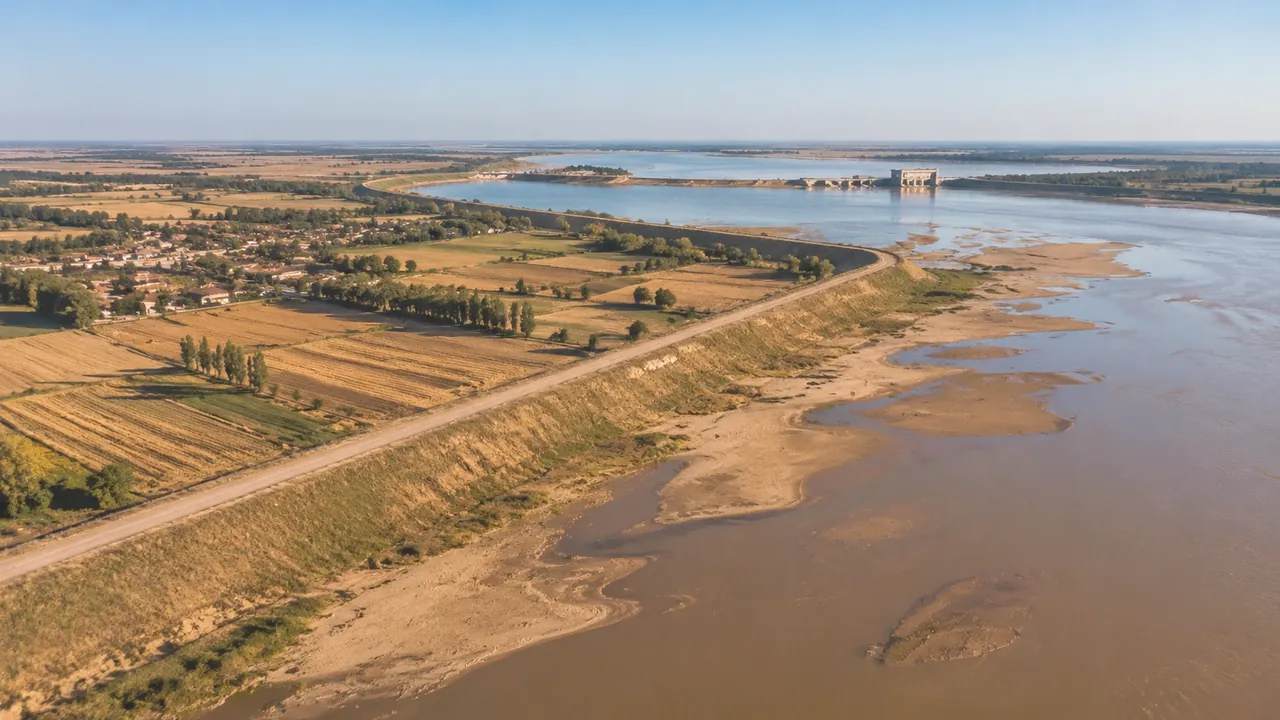
2.1 Find the depressions that hold water
Generate the terrain and look for closed depressions and flat areas with no clear outlet. These are the places where water sits after a storm, even when the river is well within its banks. Some of them are small enough to drain; others are the reason a road closes every few years. Mark them in the model and check what occupies them now.
2.2 Check the routes that cross them
Look at the roads and paths that cross the low ground. A route that dips through a depression is the route that closes when it rains. In a comparison of options, a new alignment that avoids the dip may be worth more than a larger pipe somewhere else. The model shows the dip; the drainage engineer decides how to handle it.
3 Look at what sits in the path
Buildings, car parks, substations, and access roads all sit somewhere relative to the corridor. Mapping them by exposure turns a general worry into a specific list. That list is what a mitigation conversation needs, and it is much easier to build from a model than from a set of separate maps.
3.1 Count the buildings on the low side
Mark the buildings that sit between the channel and the higher ground behind them. These are the ones that lose access when the water rises, even if the water does not reach the floor. Note their use, because a shed and a care home sit in the same place on a map and mean very different things in a review.
3.2 Note the critical uses nearby
Look for the uses that need a route out: schools, clinics, depots, utility compounds. A flood review spends much of its time on access, and the model makes the access question concrete. If the sole route out of a neighborhood crosses the corridor, that is a finding, and it belongs in the brief even before the engineering begins.
4 Compare options in plain form
Options along a flood corridor usually involve land: a wider channel, a set-back embankment, a new crossing, or a development block moved away from the bank. Comparing those options in a model is a matter of moving blocks and watching the corridor change. The comparison is about space and exposure, not about flow.
4.1 Test a wider corridor
Widen the corridor in the model and see what it takes. A wider band may remove a row of garages, a section of road, or a strip of a car park. Those losses are the real cost of the option, and they are visible at once. Keep the buildings in place and let the corridor cut through them, so the trade-off is honest.
4.2 Test a raised edge or a new crossing
Raise the bank in one version, or add a crossing in another, and compare the result with the current state. A raised edge protects one side and pushes water toward the other, which is why flood reviews rarely look at one bank alone. The model will not show that push, but it will show who is on the other side. The U.S. Federal Emergency Management Agency maintains flood map resources that help a team understand how mapped zones are drawn and revised.
5 Be clear about what a site model cannot do
Capacity is a relationship between water, channel shape, and time. A site model has the shape and nothing else. It does not know the flow, the rainfall, the tide, or the condition of the structures in the channel. Saying that plainly protects the model's usefulness.
5.1 Capacity needs hydrology and hydraulics
A hydraulic study takes the terrain and adds flow, roughness, and boundary conditions. None of that is in a generated site model, and no amount of visual detail substitutes for it. Use the model to show the geometry and the exposure, then take the capacity question to the engineers with a clear picture of the place.
5.2 Use the model to frame the question
The strongest use of a site model in a flood review is to sharpen the questions. Which crossing constrains the corridor? Which buildings lose access? Where would a wider channel take land from? Write those questions down and attach the model view. The engineers can answer them faster when the place is already legible.
6 Compare a flood corridor in GenAnywhere
GenAnywhere builds an editable 3D site model from a mapped area using satellite and map data. It identifies building footprints, estimates heights, infers building types, and includes the surrounding vegetation, with buildings, terrain, vegetation, and water as separate layers. You can replace a building, move or rotate it, adjust its height or type, and export a GLB for 3D, BIM, GIS, or game engine workflows. The model is an initial site context. It does not model flooding, and it does not assess the capacity of any channel or drainage system.
6.1 Build the corridor model
Select the corridor and a margin on both banks, then generate the model. Check that the water layer follows the channel as it appears in recent imagery, and note any place where it does not. Save this version as the baseline. It is the view everyone will refer to when the options arrive, so it is worth getting the frame right.
6.2 Test a corridor change
Duplicate the site and widen the corridor or move a block of buildings away from the bank. Compare the result with the baseline at the same camera angle. If the option removes a road, mark the access consequence in the notes. The model shows what changes on the ground, and the notes carry what the change means.
6.3 Export and mark the open questions
Export the model as GLB and share it with the team preparing the study. Add a short note with the assumptions, the places where the imagery was unclear, and the questions the comparison raised. The file carries a permanent commercial license, but the original files cannot be resold or used for AI training. Third-party data may have separate terms.
See how the site model workflow fits a review
7 FAQ
FAQ-1 Can GenAnywhere calculate flood capacity?
No. Capacity depends on flow, rainfall, channel roughness, and the condition of structures, and those come from hydrology and hydraulic studies. The model shows the land: the channel, the banks, the buildings, and the access routes. Use it to frame the engineering question and to compare options on the ground, then let the study answer the capacity question.
FAQ-2 What should I map along a flood corridor?
Map both banks, the low ground on either side, the crossings, and the buildings closest to the channel. Add the roads that provide access, because access is often the earliest thing to fail. A margin of a few hundred metres on each side is usually enough to see the relationships. Keep the model focused on the corridor rather than the whole town.
FAQ-3 How do I compare two mitigation options?
Build both on copies of the same baseline and keep the camera fixed. Compare what each option takes: land, buildings, access, or parking. Then note the exposure that remains on each side. The comparison will not tell you which option performs better in a flood, but it will show the land-take and the trade-offs that the engineering study has to weigh.
FAQ-4 Is the model usable for a public meeting?
Yes, as a context view rather than a flood map. Show the corridor, the buildings, and the access routes, and label the view as a site model with estimated heights. Do not present it as a flood extent or a capacity result. If the meeting needs mapped zones, use the official maps alongside the model and keep the two clearly separate.
Content and technical notes
This article was prepared by the GenAnywhere team with AI-assisted drafting and human review.
Product features, formats, and availability change as the platform evolves; refer to the official GenAnywhere website for current details.
For technical questions or corrections, contact support@genanywhere.com.
Last reviewed: 2026-11-20.