
Urban housing density: where GenAnywhere helps teams compare
Turning a density figure into blocks and streets a team can see, and keeping the comparison honest.
Housing density is easy to state and hard to picture. A number on a schedule says how many homes sit on a hectare; it does not say whether the result reads as a courtyard, a terrace or a wall. A map-derived 3D site scene can put several density options on the same ground and let a team compare what each one does to the street.

1 Define what is being compared
1.1 Which density measure is in play?
Dwellings per hectare, floor area ratio and people per hectare are different measures, and a comparison that mixes them produces confusion. Pick one before anyone opens a model.
Dwellings per hectare says something about how many households live on the land. Floor area ratio says how much building sits on the plot. A scheme can raise one while lowering the other, depending on unit size.
Write the chosen measure beside each option. A scene can show form, but the number still comes from the schedule.
1.2 What does the number hide?
It hides unit mix, tenure, parking and the amount of shared open space. A hundred homes in a tower and a hundred homes in a perimeter block can share a density figure and produce entirely different neighbourhoods.
It also hides distribution. The same number spread evenly across a district feels different from the same number concentrated on two sites. The World Bank urban development programme publishes comparative material on how density and land use interact.
The scene is useful because it shows distribution. It cannot tell you whether the homes are affordable or who will live in them, and those questions belong to a different discussion.
2 Put the scenario into a scene
2.1 How do you build a density option?
Start with the site and the surrounding blocks. GenAnywhere builds an editable base from map data, with buildings, terrain, water and vegetation on separate layers, so the existing context is in place before the option is drawn.
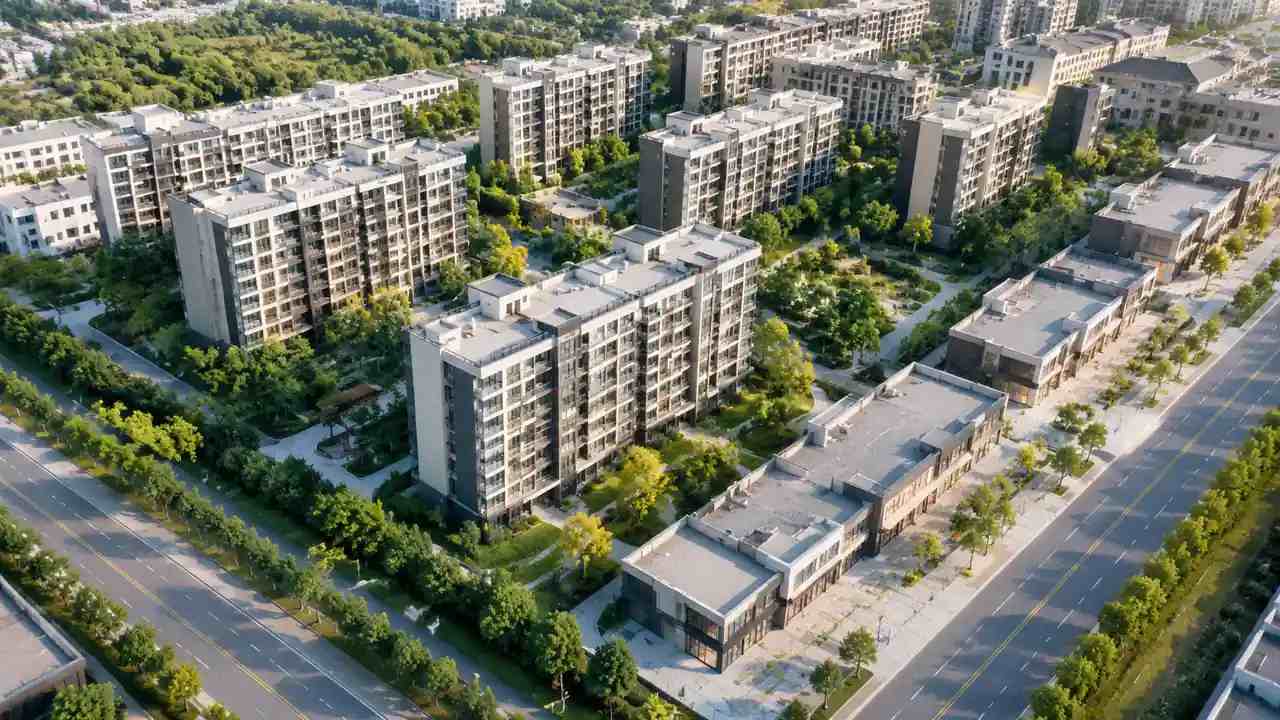
Then replace or add massing until the option reaches the target. Move blocks, change heights and adjust the footprint, keeping the unit assumption in a separate note.
Build the second option from the same base. A comparison that uses two different site models compares the bases as much as the schemes.
GenAnywhere keeps each option in an editable scene, with buildings, terrain and vegetation on separate layers. A height change or a moved block is a quick edit, so the workshop can test a variant while the room is still discussing it.
2.2 Which layers show the difference?
Hide vegetation to see the built edge and the amount of open ground. Hide buildings to see the site area and the routes through it.
Use the terrain layer when the site slopes. A density that works on flat ground can crowd a hillside once the access roads and retaining edges are counted.
Keep the same layer states for each option. A difference produced by a hidden layer is not a difference between schemes.
3 Compare fairly
3.1 How do you hold the variables still?
Keep the boundary, the camera positions and the surrounding context identical. Change one thing at a time: height, footprint or distribution.
Keep the unit size assumption constant when comparing dwellings per hectare. A scheme that hits the number with smaller units is a different product, not a denser version of the same one.
Record the assumptions beside the images. A comparison without assumptions becomes a debate about which picture looks nicer.
3.2 How do you present the trade-off?
Show what each option gains and gives up. A taller scheme may free ground for a park; a lower scheme may spread further into the block and reduce the walk to the bus.
Present two images per option: the street view and the roof view. The street view shows the experience, and the roof view shows the land.
Avoid a single composite image that blends the options. The room needs to see them as alternatives, not as a menu of features.
4 Read the neighbourhood
4.1 What changes at street level?
Check the distance between facing windows, the width of the pavement and the amount of direct sun at the corner. These are the details residents notice and schedules rarely record.

Look at the entrances. A dense scheme with a few large cores produces long internal corridors and quiet stretches of street; a perimeter block with many doors produces more activity.
Note the routes through the site. A density option that blocks a familiar cut-through will be judged on that loss, whatever the housing numbers say.
Test the doors. A scheme with a few large cores produces long corridors and quiet stretches of street, while a perimeter block with many entrances keeps more ground floors active. The difference is visible at eye level and invisible in a density table.
4.2 How do you judge open space?
Look at size, access and enclosure together. A large lawn at the edge of the site is less useful than a smaller yard that every door opens onto.
Check who reaches the space without crossing a road. A park across a four-lane street is not the same amenity as a courtyard.
Inspect the sunlight at the times people use the space. A scene can show the shadow at a chosen hour, and that is often enough to settle an argument about orientation.
5 Record and decide
5.1 What goes in the comparison note?
The measure used, the assumptions, the boundary, the camera positions and the scene date. Add the imagery date if the surrounding context matters to the decision.
Record which option the team prefers and why. A preference without a reason disappears at the next meeting.
Record the questions the scene could not answer: tenure, affordability, infrastructure capacity and traffic. These become the next work package.
5.2 What must be verified?
Verify the site area and the unit count against the drawings. A density calculated on a rough boundary can be wrong by a meaningful margin.
Verify the height assumptions against the code and the survey. Estimated heights in the context are not a permit.
Verify the access and servicing arrangements with the engineers. A courtyard that works visually may fail once a refuse truck needs to turn.
6 Avoid the common traps
6.1 When is a 3D comparison misleading?
When the options use different boundaries or different surrounding context. The eye reads the base as part of the scheme.
When the images use different cameras or lighting. A sunny view of one option and a grey view of another shifts the judgement.
When the model shows the new buildings alone and hides the existing ones. Density is a relationship, and removing half of it flatters the result.
6.2 What about infrastructure capacity?
A scene cannot tell you whether the water main, the substation or the school can take the additional homes. Those answers come from the utilities and the service providers.
Use the scene to show where capacity might be tested: the junction, the school gate, the substation edge. Then ask the relevant body for the number.
Do not let a convincing model stand in for a capacity study. The two answer different questions, and a planning committee will ask for the second.
6.3 When do you stop comparing?
Stop when the options differ by a decision the team can act on. More variants rarely change the choice.
Stop when the differences are smaller than the uncertainty in the assumptions. At that point the comparison is measuring noise.
Stop when the next question is about tenure, cost or delivery. A 3D scene has nothing to add to those, and the team should move to the right table.
Parking is often the missing variable in a density comparison. Two schemes can share a dwellings-per-hectare figure and differ by a basement, a deck or a surface lot, and that difference changes the amount of usable ground. Add the parking assumption beside each option before the room starts judging the open space.
GenAnywhere can show the ground and the buildings separately, which makes the parking footprint visible in a way a schedule does not. Use the layer view to check what the cars take before the landscape is discussed.
Draw the site and test two options in the GenAnywhere app before the density workshop.
7 FAQ
FAQ-1 Does GenAnywhere calculate density?
No. It builds a visual site model and lets a team edit building massing. Density is calculated in a spreadsheet from site area and unit numbers. The scene shows what a calculated density looks like on the ground. Keep the calculation in the schedule and use the scene only to show what the number produces on the ground.
FAQ-2 Can we compare different unit sizes?
Yes, by building separate massing options and keeping the unit assumption in the note. The scene shows form, not the number of bedrooms. A comparison is fair when the unit mix is stated beside each option. If the unit mix changes between options, the comparison is about product as well as form, and the note should say so.
FAQ-3 How much detail do the options need?
Enough to judge height, footprint and distribution. Windows and materials are unnecessary and can distract from the density question. Simple volumes with a clear ground plane work well. Add context buildings and the ground plane, then stop; extra detail rarely changes a density judgement, and it slows the workshop, which loses focus.
FAQ-4 What if the site has a slope?
Use the terrain layer and include the access roads. A slope reduces the developable area and changes how a density feels from the street. Check the option at eye level on the sloping edge, not just from above. If the slope is severe, ask an engineer before treating any part of the site as developable.
See how a site is drawn, edited and exported in the GenAnywhere workflow.
Content and technical notes
This article was prepared by the GenAnywhere team with AI-assisted drafting and human review.
Product features, formats, and availability change as the platform evolves; refer to the official GenAnywhere website for current details.
For technical questions or corrections, contact support@genanywhere.com.
Last reviewed: 2026-11-06.