
Urban climate resilience: a site checklist GenAnywhere supports
A visual checklist for heat, water and access, and the points where a 3D scene must hand over to an engineer.
Climate resilience work starts with the ground a site stands on: where water collects, where heat builds and how people reach safety. A map-derived 3D scene can make those relationships visible early. It cannot calculate a flood level or a heat index, and treating it as if it could is the quickest way to weaken a resilience case.
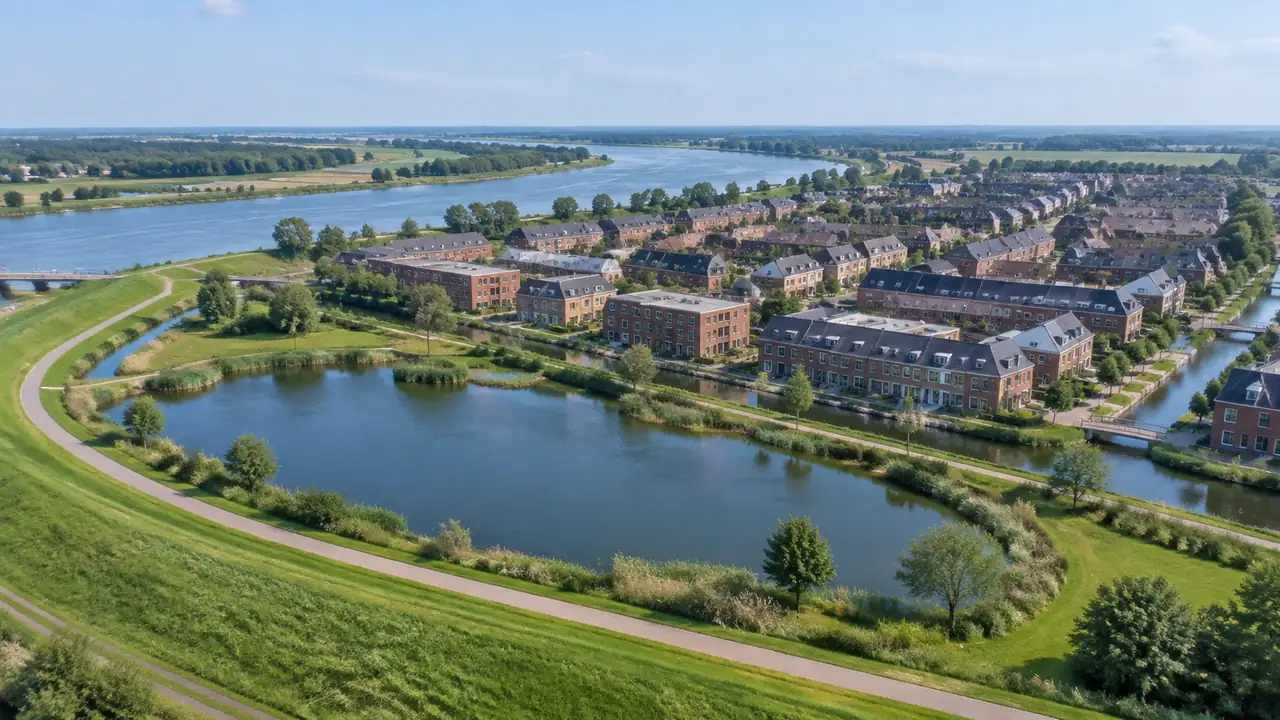
1 Frame the resilience question
1.1 Which hazard and which decision?
Name the hazard before opening a model. Heat, river flooding, coastal surge, surface water and wind each point to different geometry and different evidence.
Name the decision as well. A team choosing between two block layouts needs different information from a team testing an emergency route.
A scene that addresses "resilience" in general produces a set of attractive images with no bearing on either decision.
1.2 What can a site scene show?
It can show the shape of the ground, the position of buildings and the relationship between streets, open space and water. Those are the physical facts that resilience measures work with.
It can show where a route is overlooked, where a yard is enclosed and where a slope runs toward a row of doors. Those observations are useful to a design team even before any modelling.
It can also show what is missing. An empty gap in the built edge is often the place where water or wind enters, and the scene makes the gap obvious.
2 Check the ground
2.1 Where does water collect?
Look for low points, closed corners and routes that run downhill into a yard. A scene built from terrain data shows the shape, even when it does not show the drainage.
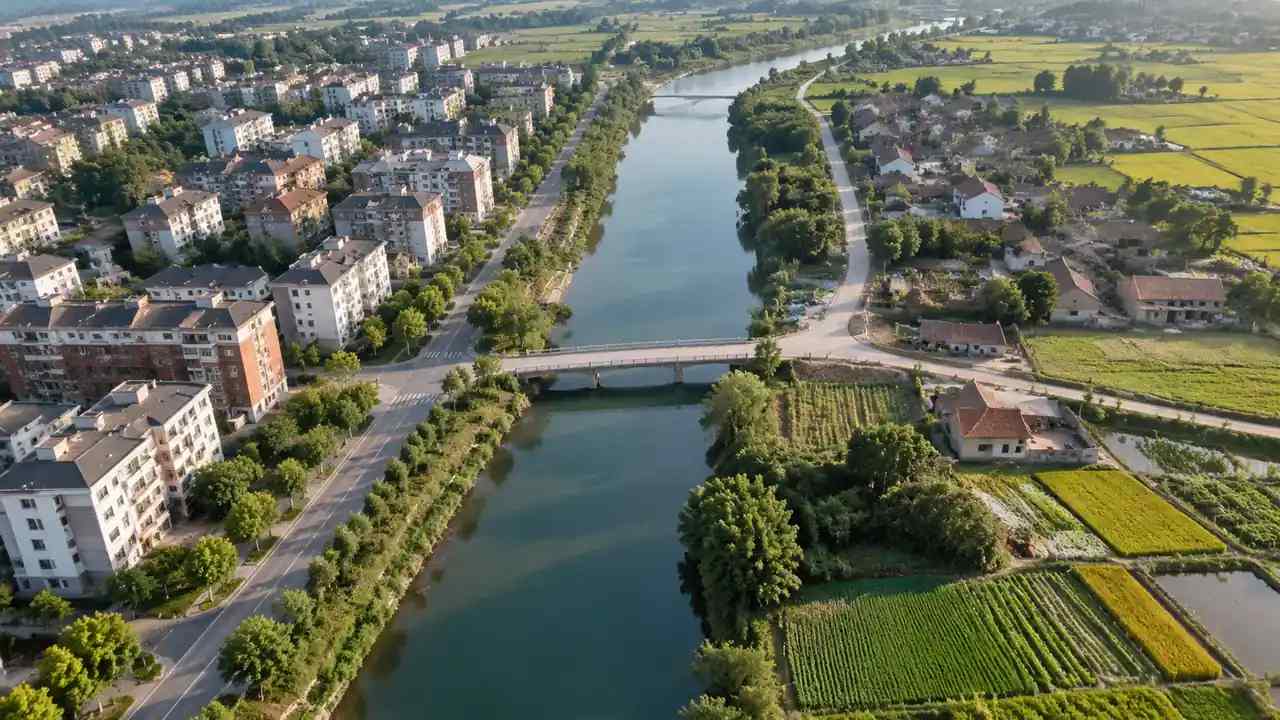
Check the edges between paved and green surfaces. A hard forecourt that drains to a single gully is a different risk from a planted edge that spreads the flow.
Look at the underpasses and sunken entrances. These are the places where water accumulates, and they are visible as geometry in the model.
GenAnywhere builds the scene from map data, with terrain, water, buildings and vegetation on separate layers. Hiding the buildings is a quick way to read the ground and the water together.
2.2 How do slopes read?
Walk the slope rather than looking at the plan. A gradient that looks gentle from above can be steep enough to matter at a doorway.
Note the direction of the fall. A site that slopes toward the street behaves differently from one that slopes away, and the difference affects where water goes and how people move.
Test the level changes between the public realm and the building. A step at the entrance is a small design choice with a large effect during a flood or a heat event.
3 Check exposure
3.1 What does massing do to sun and wind?
Massing controls shade and shelter. A courtyard can be a cool refuge at noon and a wind tunnel in winter, depending on the surrounding heights and gaps.
Use the scene to compare layouts at the same hour. A block that shades a playground in the afternoon is doing resilience work, and the effect is visible as a relationship between volumes.
Inspect the gaps. A single opening in a long frontage can concentrate wind, while a broken edge spreads it, and the pattern is easier to see in three dimensions.
GenAnywhere lets the team hide layers and move volumes, so a courtyard can be tested against a terrace without redrawing the block. That is enough to compare shade and shelter at the scale of a street.
3.2 Where are the vulnerable edges?
Look at the ground floors of the buildings nearest the water, the slope or the open edge. These are the places where exposure matters most.
Check the uses at those edges. A storage room at a low level is a different risk from a lobby, and the scene can show where each sits.
Look at the routes beside them. A path that runs along a exposed edge may be unusable in bad weather, even when it is the shortest way through.
4 Check access and response
4.1 How do response routes read?
Mark the routes that emergency vehicles and maintenance teams would use. Check the widths, the turning circles and the points where a route narrows.
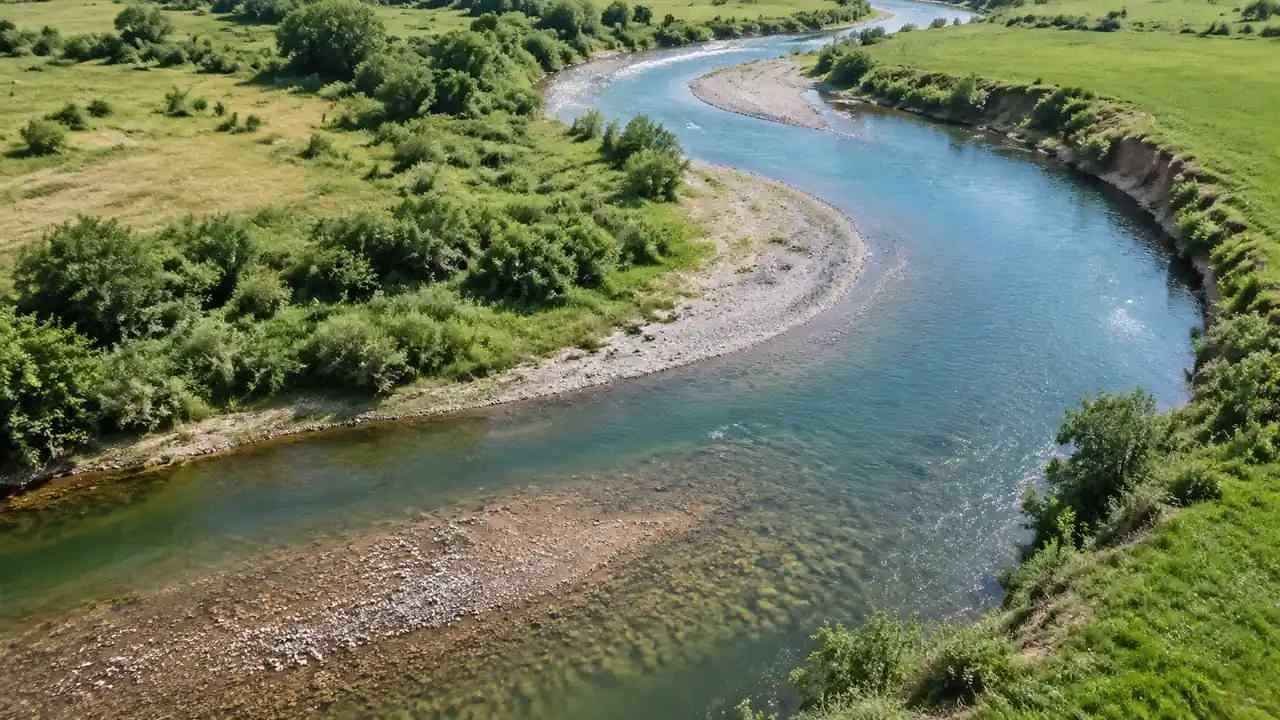
Note the second route. A site with one access point is a site with a single failure, and the scene shows whether a second route exists.
Test the route at night and in bad weather. A path that depends on a gate, a lift or a flight of steps is fragile, and the dependency is visible in the model.
4.2 What role does open space play?
Open space can hold water, provide shade and offer a place to gather. It can also be the lowest point on the site, which changes how it should be designed.
Inspect the size and the connections. A large space at the edge is less useful than a smaller one that every street can reach.
Check the surfaces. A lawn, a paved square and a planted basin behave differently, and the difference belongs in the resilience note rather than in the rendering.
Check who reaches the space in a heat event. A shaded yard beside a care home does more than a larger park across a road, and the walk is part of the benefit.
5 Record and hand over
5.1 What goes in the checklist?
The hazard, the decision, the scene date and the imagery date. Add the layers used and the views tested.
Record the observations by location: the low corner, the single access, the exposed ground floor. A list of places is more useful than a list of adjectives.
Record the questions for specialists. A visible low point is a prompt for a drainage study, not a conclusion about flood risk.
5.2 What needs an engineer?
Flood depths, flow paths, drainage capacity and structural resistance need hydraulic and structural work. A scene can show where those questions arise; it cannot answer them.
Heat needs measurement and modelling. Shade is visible, but air temperature, humidity and night-time release are not.
Wind needs simulation. A gap in a frontage suggests a wind issue; it does not quantify it.
Maintenance is part of resilience. A gully that is never cleared, a pump that is not tested and a shade structure that is not repaired turn a design measure into a liability. The visit and the management plan matter as much as the geometry.
GenAnywhere can show where the vulnerable points sit in relation to the site, and the layers let a team isolate the ground or the buildings. That is a way to build a maintenance route, not a substitute for the inspection itself.
6 Keep claims bounded
6.1 When is the scene misleading?
When the terrain is simplified. A small depression that matters for drainage may not survive the resolution of the base.
When the imagery is old. A new wall, a raised road or a cleared site can change the flow, and the scene will not know.
When the rendering implies performance. A green roof drawn in a model does not prove cooling, and a blue surface does not prove storage.
6.2 What about flood modelling?
Flood modelling is a separate discipline with its own data, assumptions and review. Use the scene to frame the area and the assets at risk, then commission the hydraulic work.
Do not draw a flood line on a generated scene and present it as a result. That is the kind of claim the platform cannot support, and it invites a challenge the project will lose.
Where a published flood map exists, use it as the authoritative layer and treat the 3D scene as the place to understand its consequences. The IPCC assessment reports set out the wider climate context that a local study has to sit within.
6.3 When should the team stop?
Stop when the physical observations are recorded and the remaining questions need specialist modelling.
Stop when the scheme moves into engineering design, where the geometry must be measured rather than estimated.
Stop when the scene is being used to reassure rather than to test. Resilience work should leave the team with harder questions, not softer images, and a checklist of places is a better output than a set of renders.
Draw the site in the GenAnywhere app and mark the low points before the next resilience workshop.
7 FAQ
FAQ-1 Does GenAnywhere calculate flood risk?
No. It builds a visual site model from map data. Flood risk needs hydraulic modelling, surveyed levels and local records. The scene can help a team see where those questions apply, but it is not a risk assessment. Keep the hydraulic study separate and use the scene to show where its findings land on the site.
FAQ-2 Can the model show heat?
It can show shade and surface relationships at a chosen time. It cannot show air temperature, humidity or night-time cooling. Heat assessment needs measurement and simulation. Use it to compare shade at a fixed hour, and leave temperature claims to measurement and modelling, which need their own inputs and a local study.
FAQ-3 Is the terrain good enough for drainage work?
No. Terrain in a map-derived scene is simplified and should be treated as context. Drainage design needs a measured survey and an engineer's assessment of levels and capacity. Treat the terrain as a prompt for the survey, not as a substitute for it. The engineer needs levels, not a surface.
FAQ-4 What can a planning team use the scene for?
For framing: where water might collect, where access is fragile, where shade is missing and where the public realm could do more. Those observations become the brief for specialist studies. Record those observations as questions for specialists, not as findings the scene has proved. That wording protects the review and keeps the team honest.
See how a site is drawn, layered and exported in the GenAnywhere workflow.
Content and technical notes
This article was prepared by the GenAnywhere team with AI-assisted drafting and human review.
Product features, formats, and availability change as the platform evolves; refer to the official GenAnywhere website for current details.
For technical questions or corrections, contact support@genanywhere.com.
Last reviewed: 2026-11-06.